I don’t use the multinode dashboard, but from my experience the CLI dashboard shows ~5GB free on a full node (ingress has stopped) while the GUI dashboard shows still free space.
Storage Node Dashboard ( Node Version: v1.137.5 )
======================
ID 1ydNTgYoCUTxB31dXrCXxu4tPX4T4phJaWRztfQmdvZq6CPXrY
Status ONLINE
Uptime 431h51m56s
Available Used Egress Ingress
Bandwidth N/A 180.91 GB 109.46 GB 71.45 GB (since Oct 1)
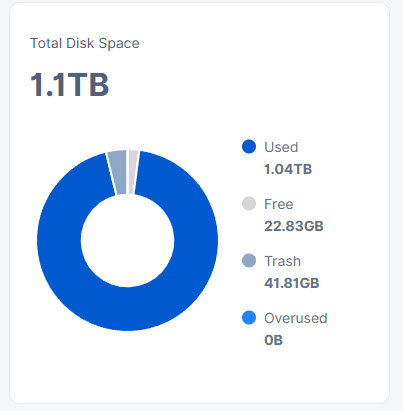
Disk 4.98 GB 1.04 TB
Here the GUI:
From a bigger Node:
Storage Node Dashboard ( Node Version: v1.137.5 )

======================

ID     1gr19eA1Sx1gkNhWUW3WjULhaTgvLnXoCjJXinGNXA8y7xosA3
Status ONLINE
Uptime 170h18m8s

                   Available        Used        Egress       Ingress
     Bandwidth           N/A     0.85 TB     539.76 GB     314.16 GB (since Oct 1)
          Disk     269.72 GB     5.95 TB
Here the GUI:
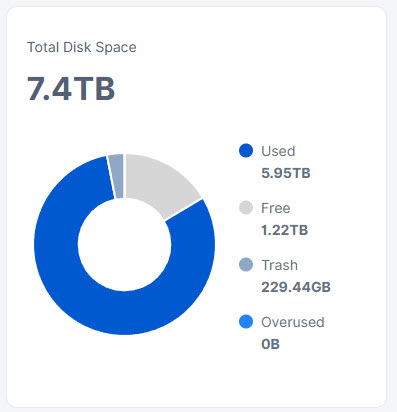
Used, Free and Trash sum up to 7.4TB, so the calculation is fine.
My Nodes are all migrated to Hashstore and i think the difference between CLI and GUI for the free space lies in the not compacted LOG files.
Hashstore stats:
2025-10-13
Node ID: 1gr19eA1Sx1gkNhWUW3WjULhaTgvLnXoCjJXinGNXA8y7xosA3

Hashstore: AP1
238981732       NodePath/storage/hashstore/SatAP1/
Files:
257

Hashstore: EU1
1703842740      NodePath/storage/hashstore/SatEU1/
Files:
1673

Hashstore: US1
5016288664      NodePath/storage/hashstore/SatUS1/
Files:
4865
This sums up to 6,959,113,136 Byte or ~6.959TB physically used space by Hashstore.
Perhaps we need an extra category for the not yet recovered free space in the LOG files?