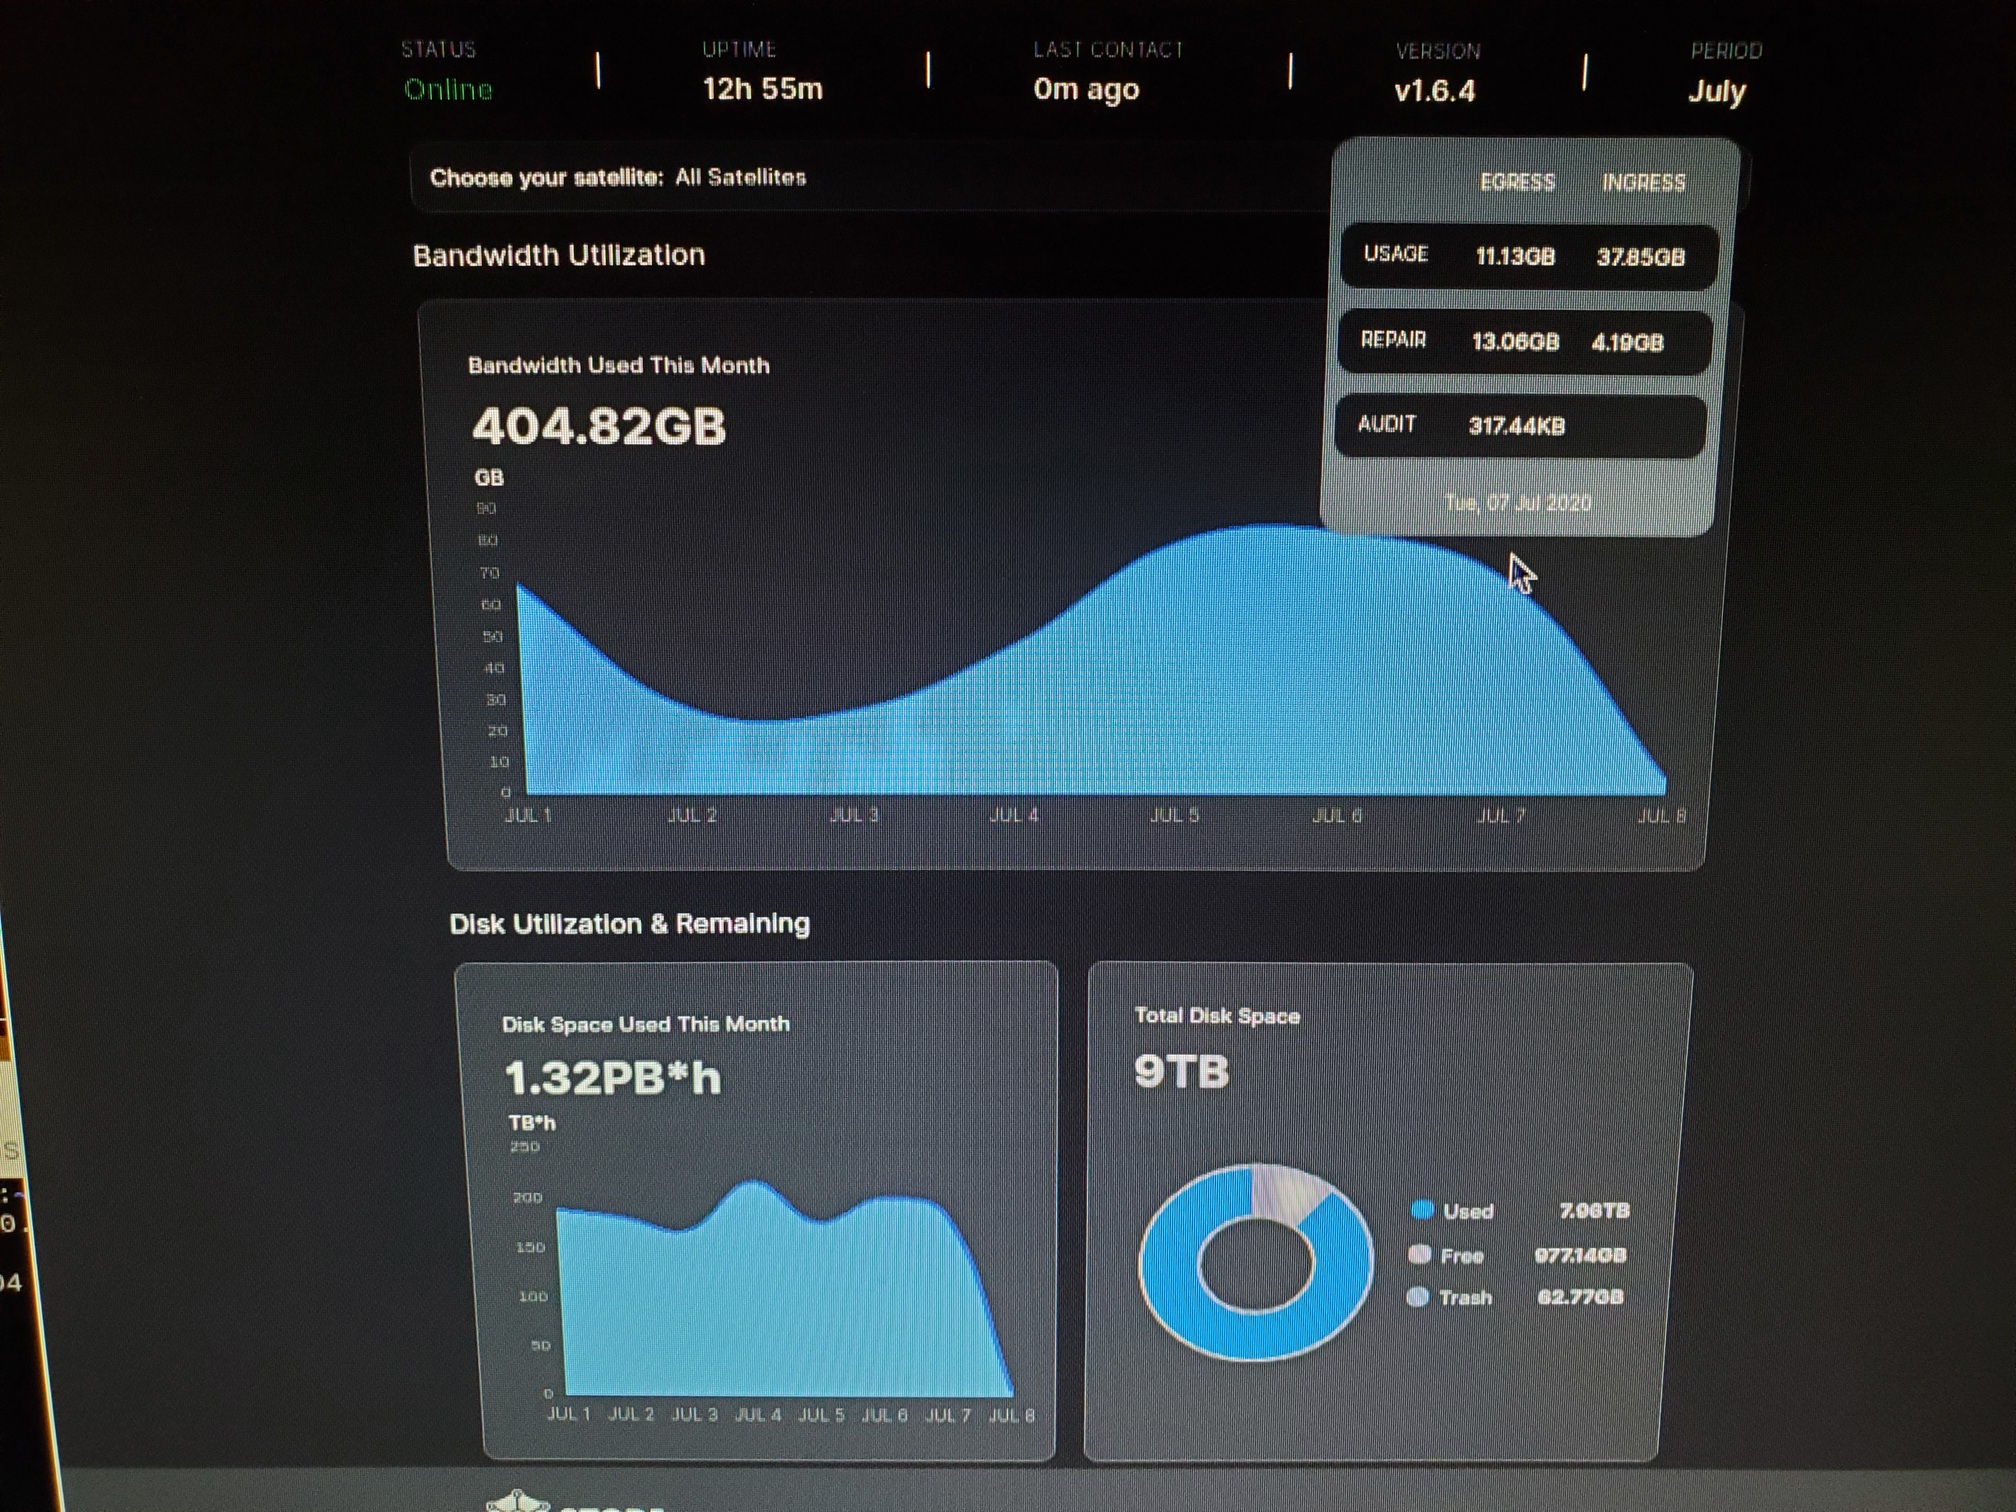
July 7th:
Node 1:
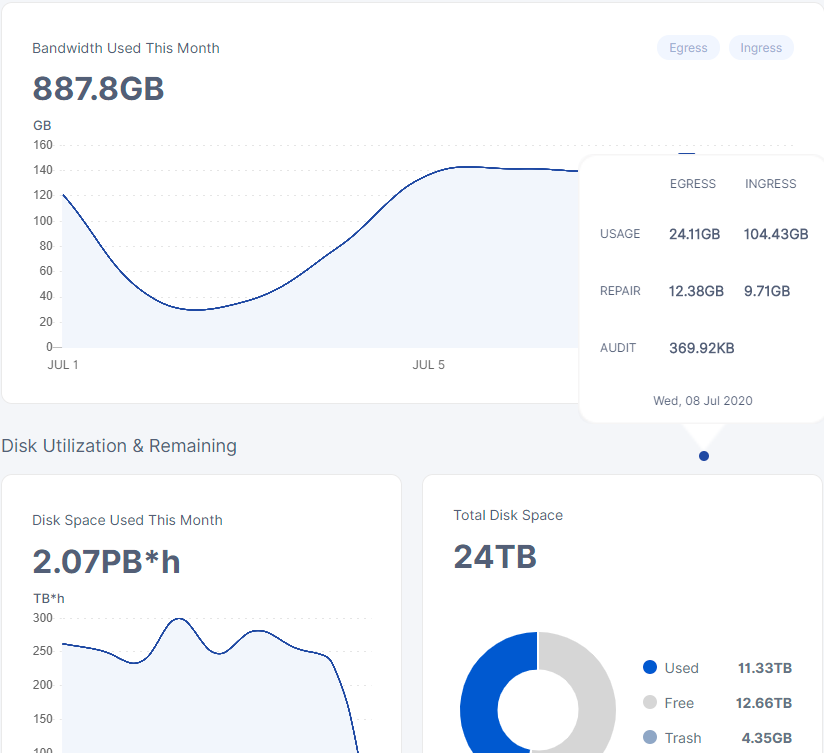
At some point in the AM on 07Jul this node was showing as full, since it was previously allocated 8TB for Storj. When I noticed it was not receiving any additional uploads, I stopped it, ran update and upgrades, and then changed config to 9TB and restarted it since it’s a 10TB drive.
Total downtime was no more than 10 minutes, but there’s a noticeable difference in ingress between the two nodes.
Node 2:
Although this node is no where close to being filled, I also stopped it at the same time as Node 1, ran update and upgrades, and then changed config to 10.8TB from 10TB as it’s a 12TB drive.
I’ve said two separate things you may be referring to:
Recently uploaded data is often downloaded. This is mostly about data uploaded and downloaded on the same day. Might be a testing pattern, but it can happen for customers who verify backups after uploading as well. This doesn’t mean the older it gets the less it gets downloaded. Though there could be other less predictable usage patterns that could cause that behavior too.
There was a period in which a lot of old data was downloaded in the beginning of this year. That was mostly to reward loyal long time node operators.
In general though, it’s pretty unpredictable and things will likely change. Though it wouldn’t surprise me if some similar patterns emerge. The same thing will likely happen for deletes. The chance of deletions for pieces that are exactly 1, 2 or 3 years old for example are much higher because backups are often removed after such time spans. etc.
i just remember the first bit about recent uploaded data is more often downloaded…
seems there is a trend towards a dropping in egress depending on data stored on a subnet tho…
well i fully expect that storj will at some point rewards us for keeping their test data… by downloading some of it atleast… and i doubt test data will completely vanish… it will most likely continue to be a think just to gauge how the network is behaving…
ingress sure looks predictable… xD i suspect the successrates has to be like 99% when we get to see them…
egress also seems to have pattern to it… atleast depending on node size… which is kinda weird… because one of the big nodes in this is like 12 months… and mine is only 5 barely i think… maybe 5 today actually yet i seem to have lower egress to stored ratio than anyone else… ofc i also have the most data…so i have to guess it’s a test data thing… or that the older data gets the higher the odds that it will be downloaded again goes up…
would be interesting to keep track of deletions also… i mean ingress is very useful… but whats is worth if we don’t monitor how much is deleted…
you know if anyone suggested getting a deleted this month graph added to the dashboard?
it kinda seems pretty relevant all things considered…
also really need more data before i can say that i’m always behind on egress… not that many data points yet…
and maybe get a better way of collecting this… when i kinda figure out exactly what data we want and how to define it in relation to each other.
They won’t be. Keep in mind you’ve been measuring used bandwidth not success. Last I heard 110 transfers are started and 80 succeed. So 73% on average. The other 27% will like be mostly transfered by the time they are cancelled, so that difference won’t show up in these bandwidth tests.
I don’t think so. Sounds like a good idea for a feature request.
okay, so maybe not 99% but from the data we are seeing here… it very much seems like everybody if online and functioning optimally will get nearly exactly the same ingress… so whatever the successrate it… it has to be almost the same across the board… but will certainly be interesting to actually the real number and if there is anything we can do to optimize it…
kinda doubt there is from the numbers we are seeing here… i might disconnect my l2arc for a few months and spin up a node on the ssd when we get the real successrates…
just to see how it runs and if it behaves differently…
so what are you saying with that… that the 27% cancelled will be deleted later?
again why we should really have a good view of the deletions…
That’s where I have to disagree. Someone who has a 50% success rate could still have transfered 90% of the other pieces it wasn’t able to finish and end up with 95% of the bandwidth but only 50% of the data. The small differences you are seeing now are that 95% number. I expect differences in success rates to be much larger.
I’m saying they are ditched right away when the transfer is cancelled. There won’t be a separate delete line for it as it isn’t a separate event.
if it is the actual bandwidth used… then on avg the cancelled pieces would be not completely downloaded… if we say they are 80% which i still think is very close … in theory the avg would be 50… ofc other factors may come into play… so we will put it high so we lean towards the most difficult to detect…
so 50% which is only 80% done… that still gives a deviation of 10% on the whole number…
we have been seeing numbers that are accurate within like 1% … ofc early guess but it seems to be the norm rather than the rarity… so will we set it up to 90% then it would be 5% off in of the whole… and if we halved that by saying only 25% failed… and that would still put us at 2.5%
which still seems extremely outside the variations we are seeing…
from the data i got… my bet is most variation in cancelled uploads we will see is within 1%
ofc there is one way to get around this problem… that is if the cancelled downloads complete and then is trashed afterwards…
else the … sound of gears moving … maybe thats why some people have so much trash and my low latency and high iops system has very little… it would kinda fit…
but i know you hate when i put up hypothesis xD alas i digress…
else the ingress numbers should show it…
ofc there is also the question if ingress only counts successful… but if it only counted the successful, then because the number of pieces allocated from the satellites are also equal, then the ingress would deviate with the successrate, but it doesn’t…
unless if the few systems we have monitored in this thread all are in about the same range… within a 1% deviation… which seems unlikely… unless ofc if the successrates only drop one certain very limited systems… such as people with smr…
but i kinda like the trash idea… so its counted as ingress(fully downloaded) and then deleted again afterwards… on the slower systems… making them even slower and filling up with trash… xD thats would fit right in with how the universes sense of irony is…
and would be funny, if it wasn’t so sad…
ofc in this i assume that ingress is actual ingress that hits the disk… of complete pieces…
Only when it contradicts stuff we already know. I don’t think incomplete transfers end up in trash, but it’s possible that some transfers complete on the node end, but not in time for the first 80, so the satellite doesn’t have it as a valid piece. After which garbage collection could catch it. So I approve of this hypothesis. I use an SSD cache as well and I see low amounts of trash as well.
But I’m fairly certain that the ingress shown on the dashboard is all ingress, including incomplete pieces. I suggest we just wait until the logging fix is merged into a release and check success rates then. This is a very small sample size though, so we may just be looking at similarly performing nodes.
yeah this sample piece of SNO’s all have shown actual interest in how their systems is performing… which might rule a lot of poorly performing systems out…
yeah i think i read somewhere that there was a patch one could apply to fix the logging issue… but yeah i’m certainly not going to introduce experimental code…
however after i was testing your awk online audit fail storagenode stop, i’ve been looking a lot at my error’s … it’s almost likely they are latency based… my node would run for almost days without a single error… until i start to spin up extra vm’s and utilize the pool a lot more…
then basically immediately i got errors and it would shut down the node…
which is why i kinda want to try to run a node on an ssd for a bit… see if near zero latency will make it all run flawless… doubt it… but at worst i run without a l2arc for a couple of months and get a sense of just how much good work its doing…
and at best it’s a way to reduce errors… not that it’s really that useful since running all ssd storagenodes… tho possible is doubtfully profitable or economical… maybe if one is looking super long term… would greatly reduce the energy bill… ofc have done the math and it’s still far from worthwhile… but one day in the near future, it might be…
@TheMightyGreek you just gave us your node id… but i believe that is sort of public anyways…
we just don’t know who is who… but really most likely that can be figured out with a bit of deduction and using information already existing.
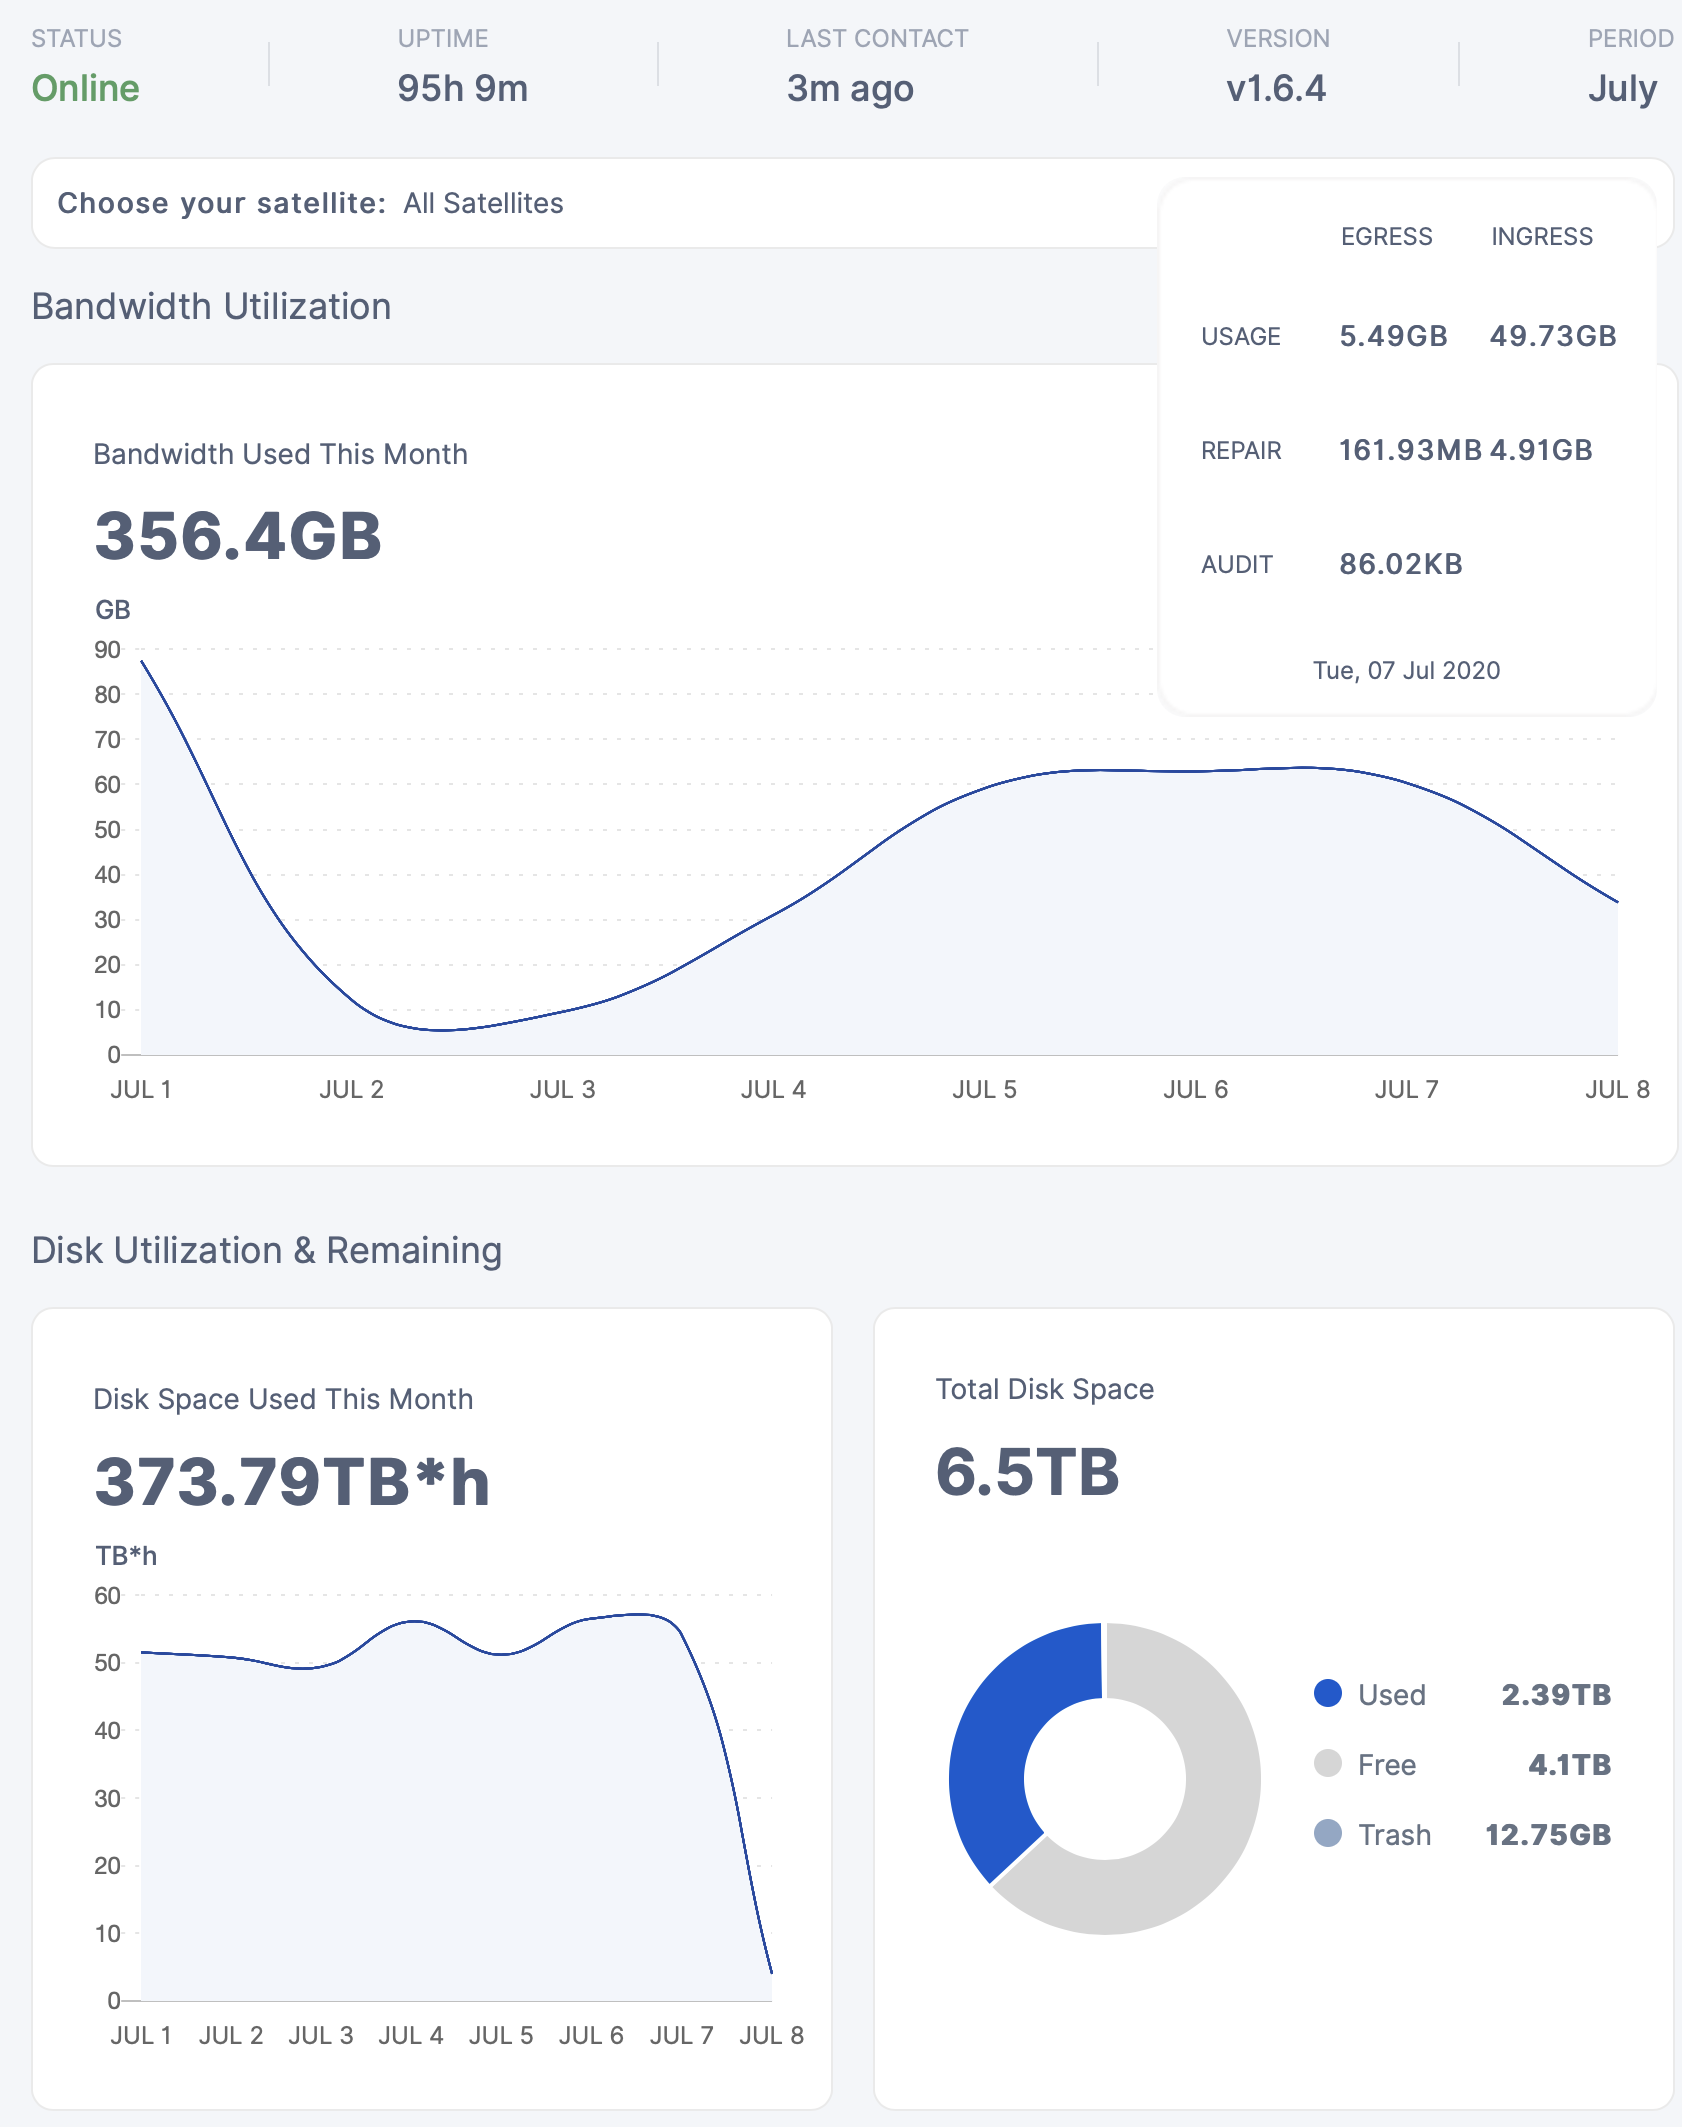
yeah ingress keeps going up… even if the ratio gets lower…
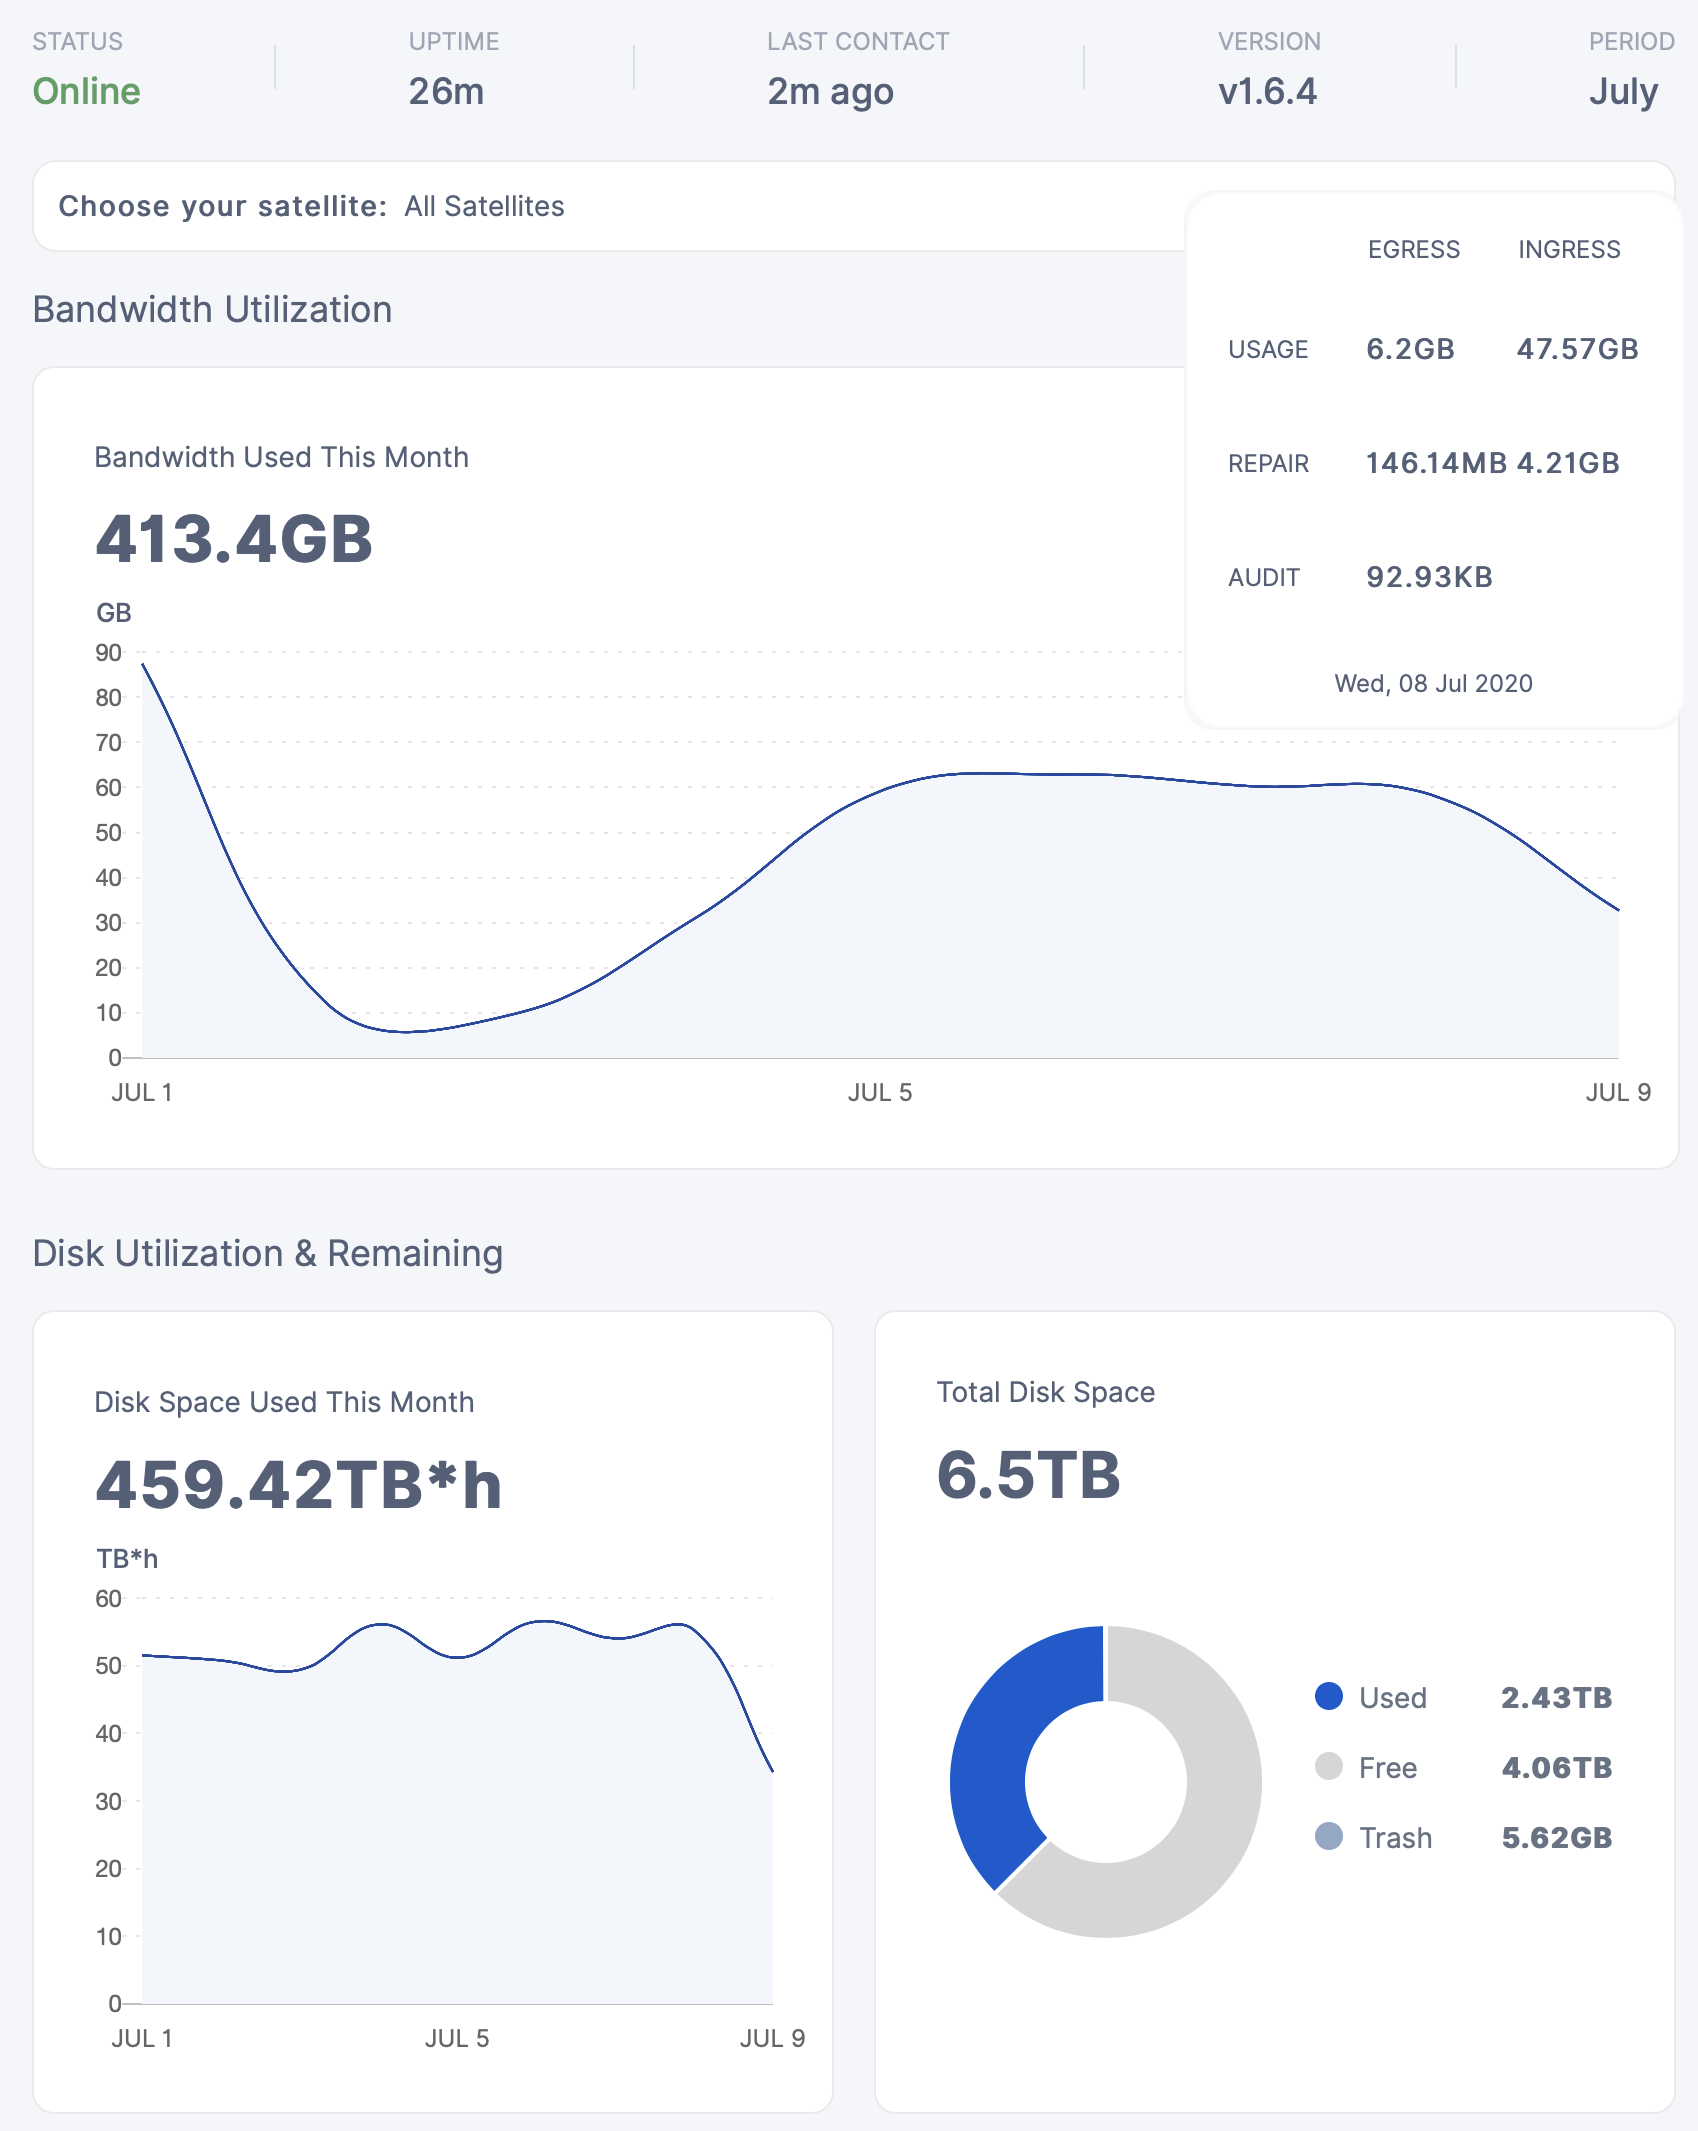
hmmm just realized something… the used space is current, while the ingress and egress is by date… so really for accurate results it has to be close together… like say if a week passes… then the ‰ of stored will go down because the stored is usually going up, even if it’s from the same date…
not a lot tho… but like say in your case… mighty … if you got 5mb/s which would be 432gb in a day… that would increase your node size by almost a 1/3 … and thus if the ‰ of stored.
was imaged from the same day or after a day of 5mb/s then it would drop your result by like 25%
ofc if it was me then it would be like 5% or less… .so i guess after a while it becomes sort of meaning less… i just didn’t think about that before…
so the images has to be taken on about the right time… a day or two wouldn’t matter to much… but if one is a week out then stored to egress would be start to drift.
another interesting thing about it… is that your egress to stored went up by 0.5 since yesterday
against my 0.6
and ofc these numbers are could be more accurate… and is subject to drift…however it kinda looks like the egress number is sort of fixed by node capacity and then the change might be basically the same…
which might actually suggest (if true) that egress is also highly predictable and controlled…
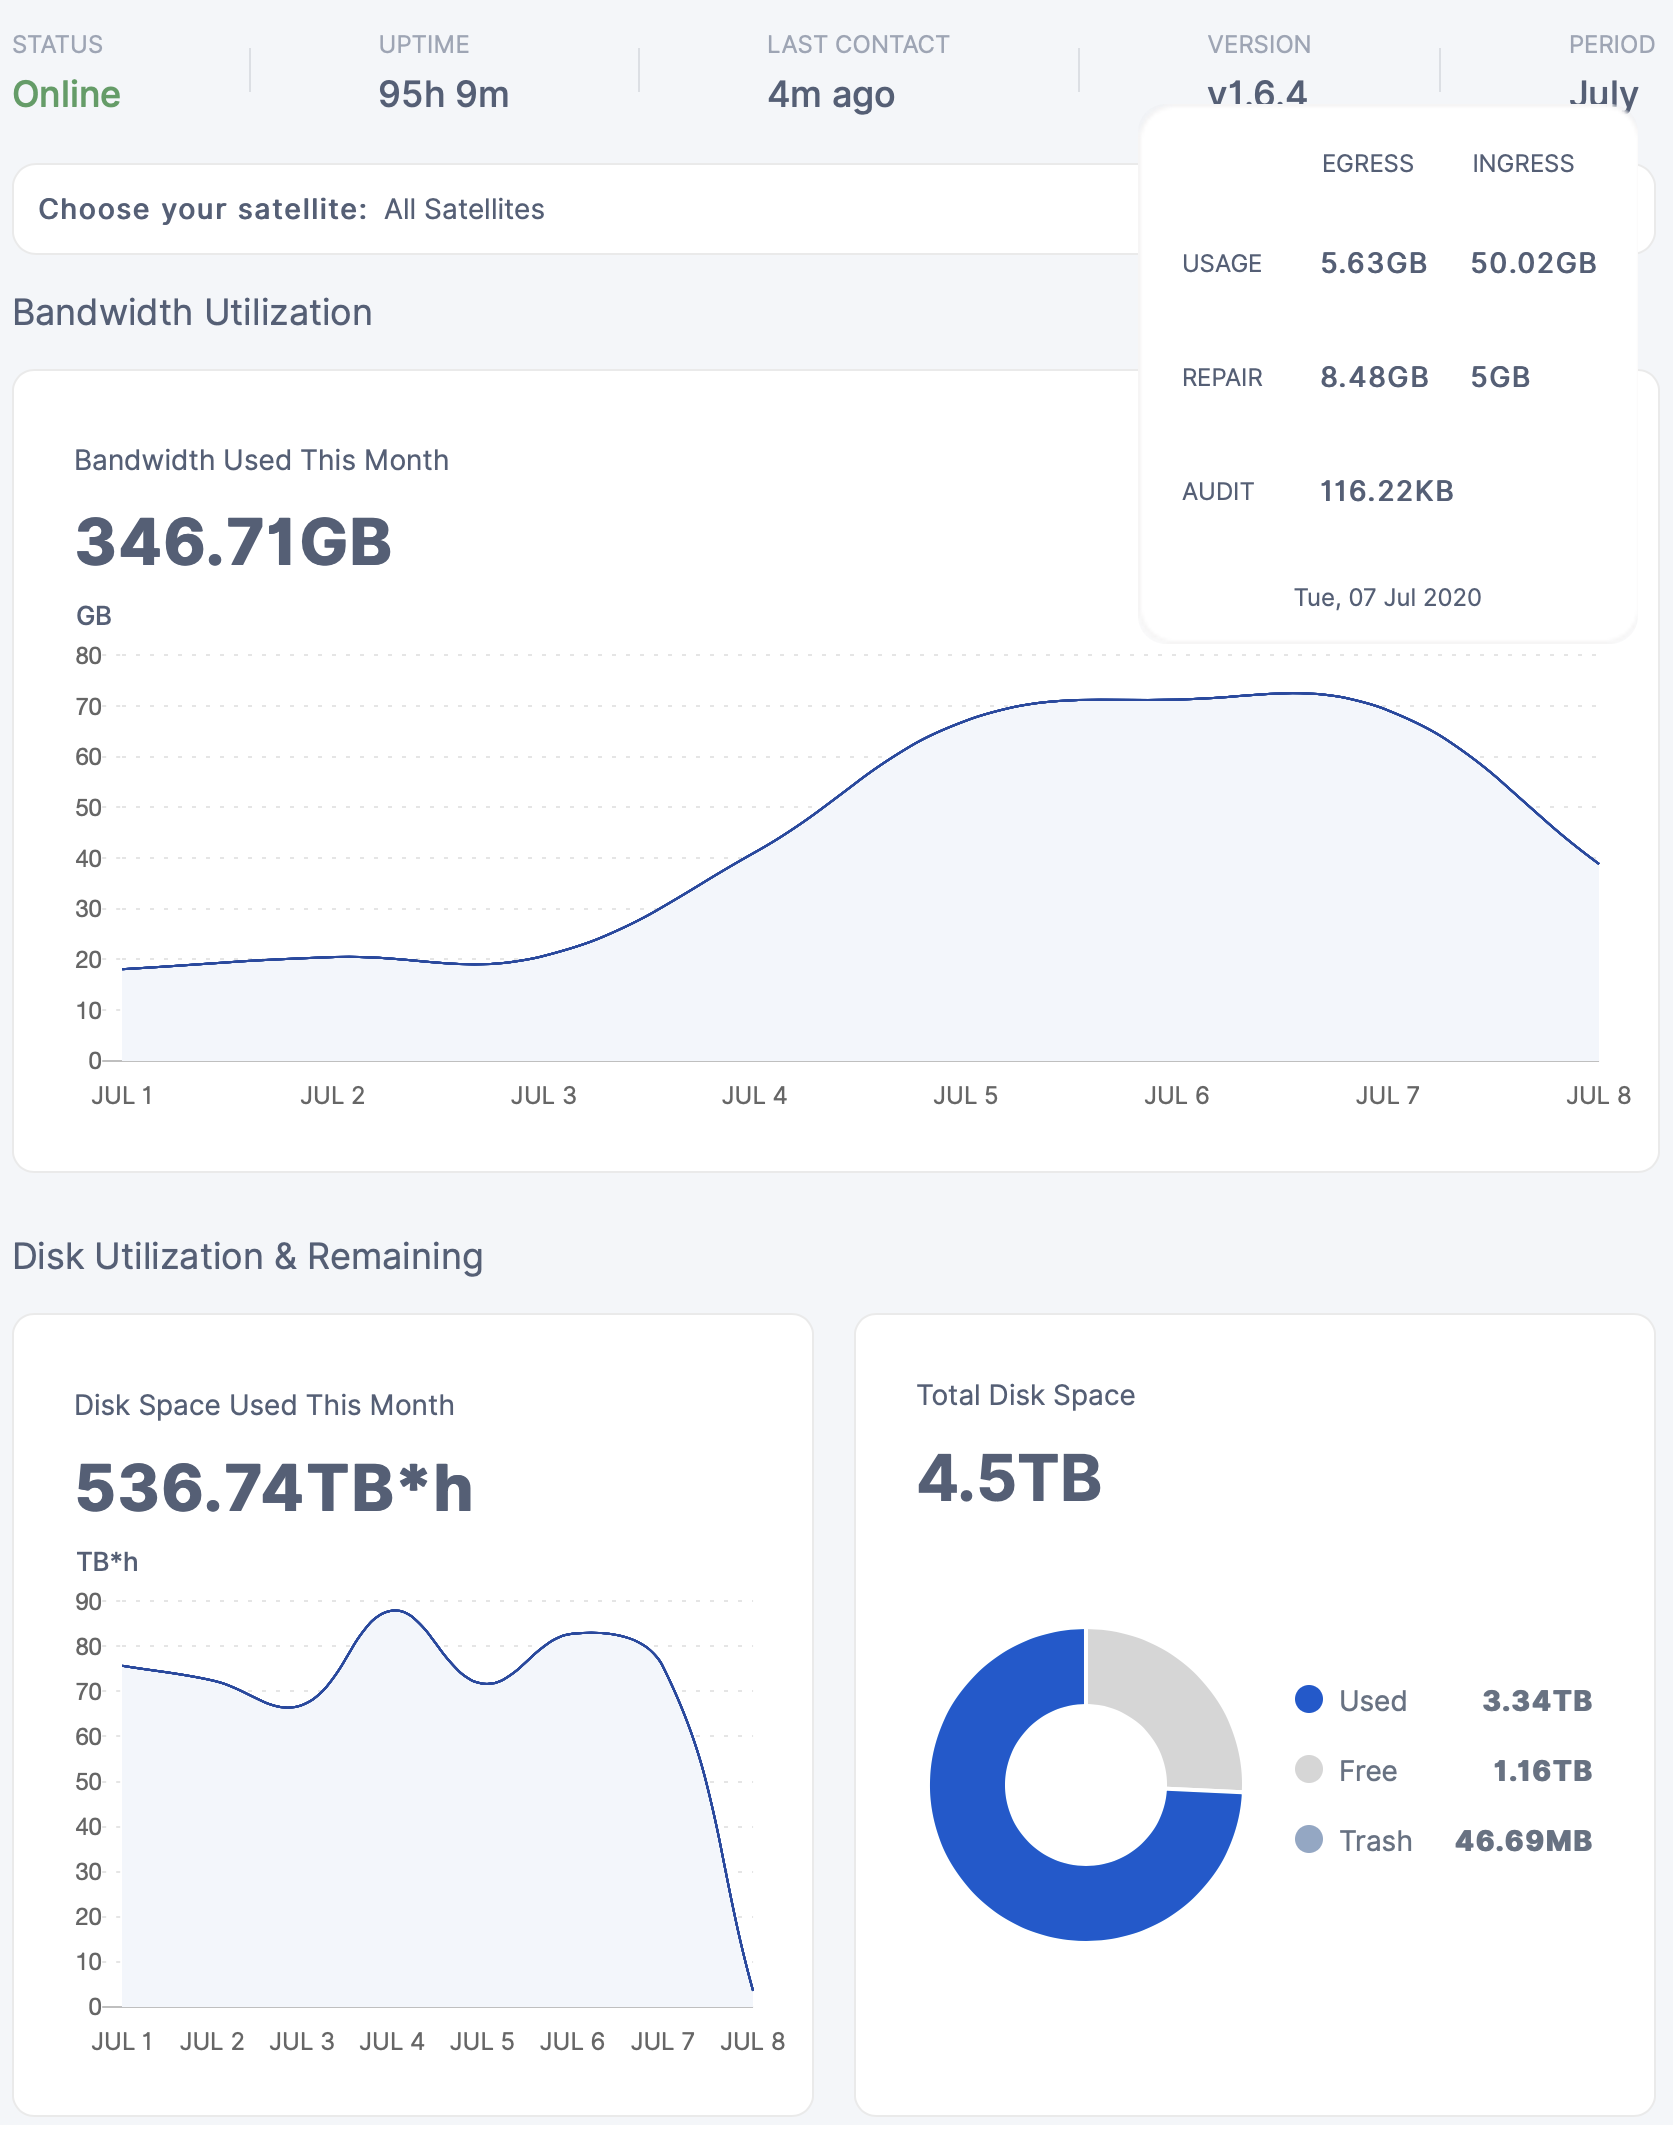
duidn’t think about that, I get about 100 more GB in my node every day.
I’ll try to take the screenshot at 8am every day so that the difference is minimal.
Also I don’t think the node ID is that critical, the last 10 characters are missing from the pic so I should be alright anyway
Edit:
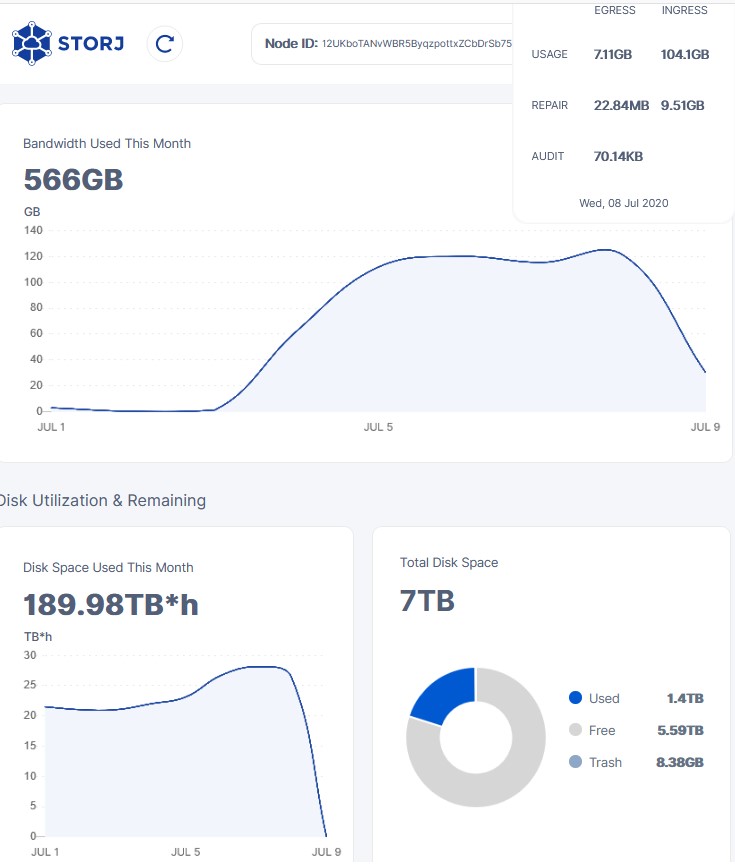
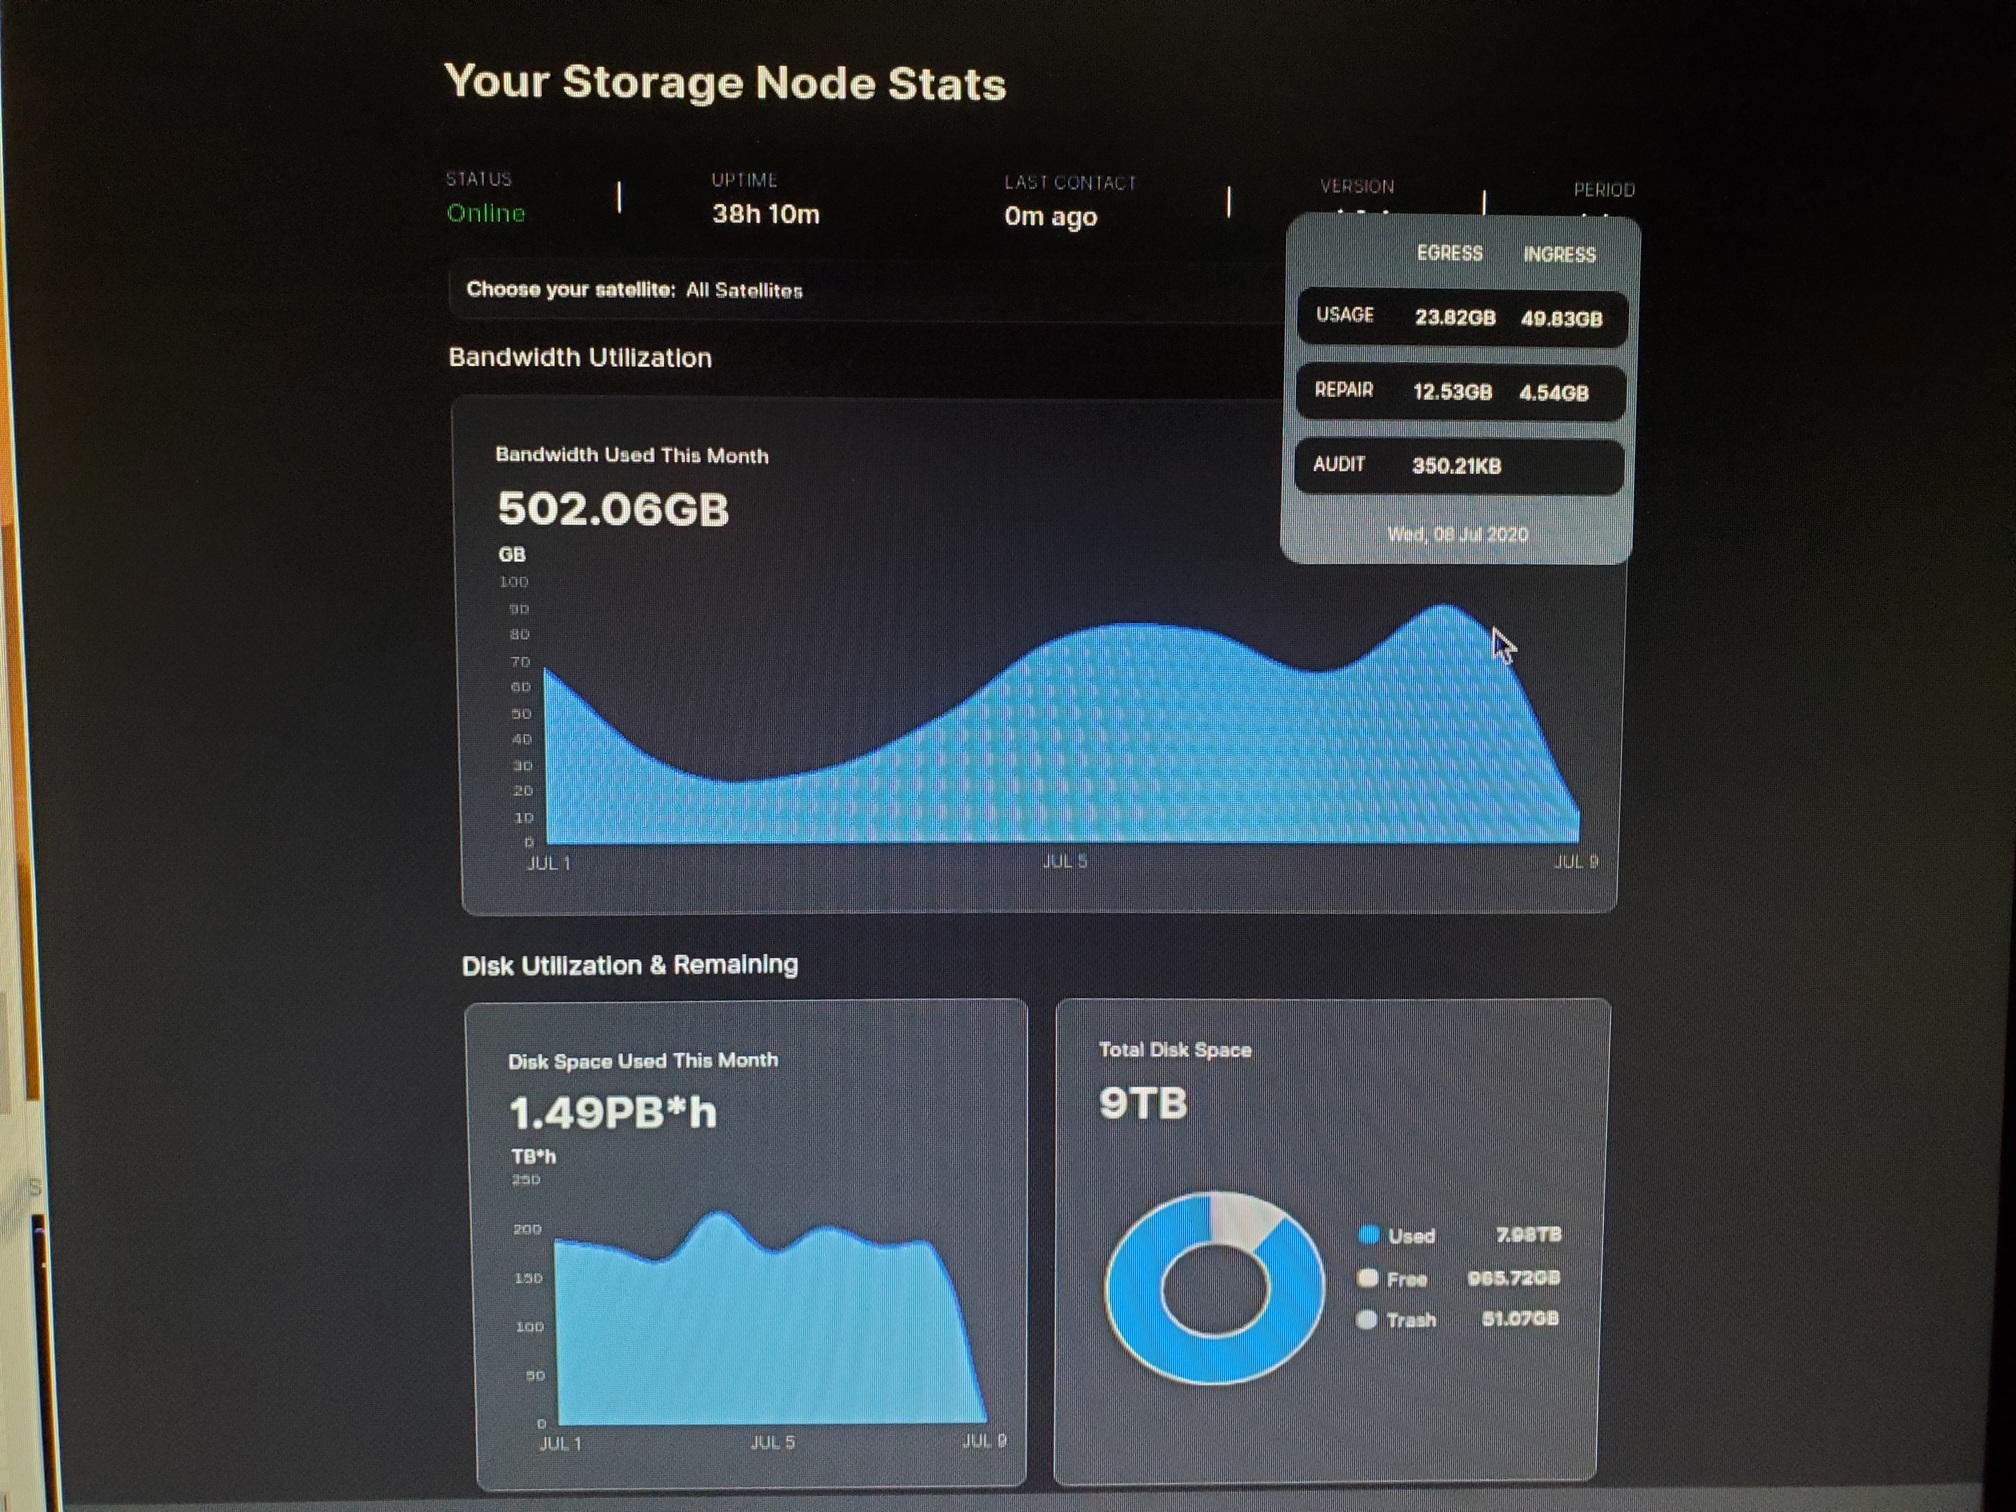
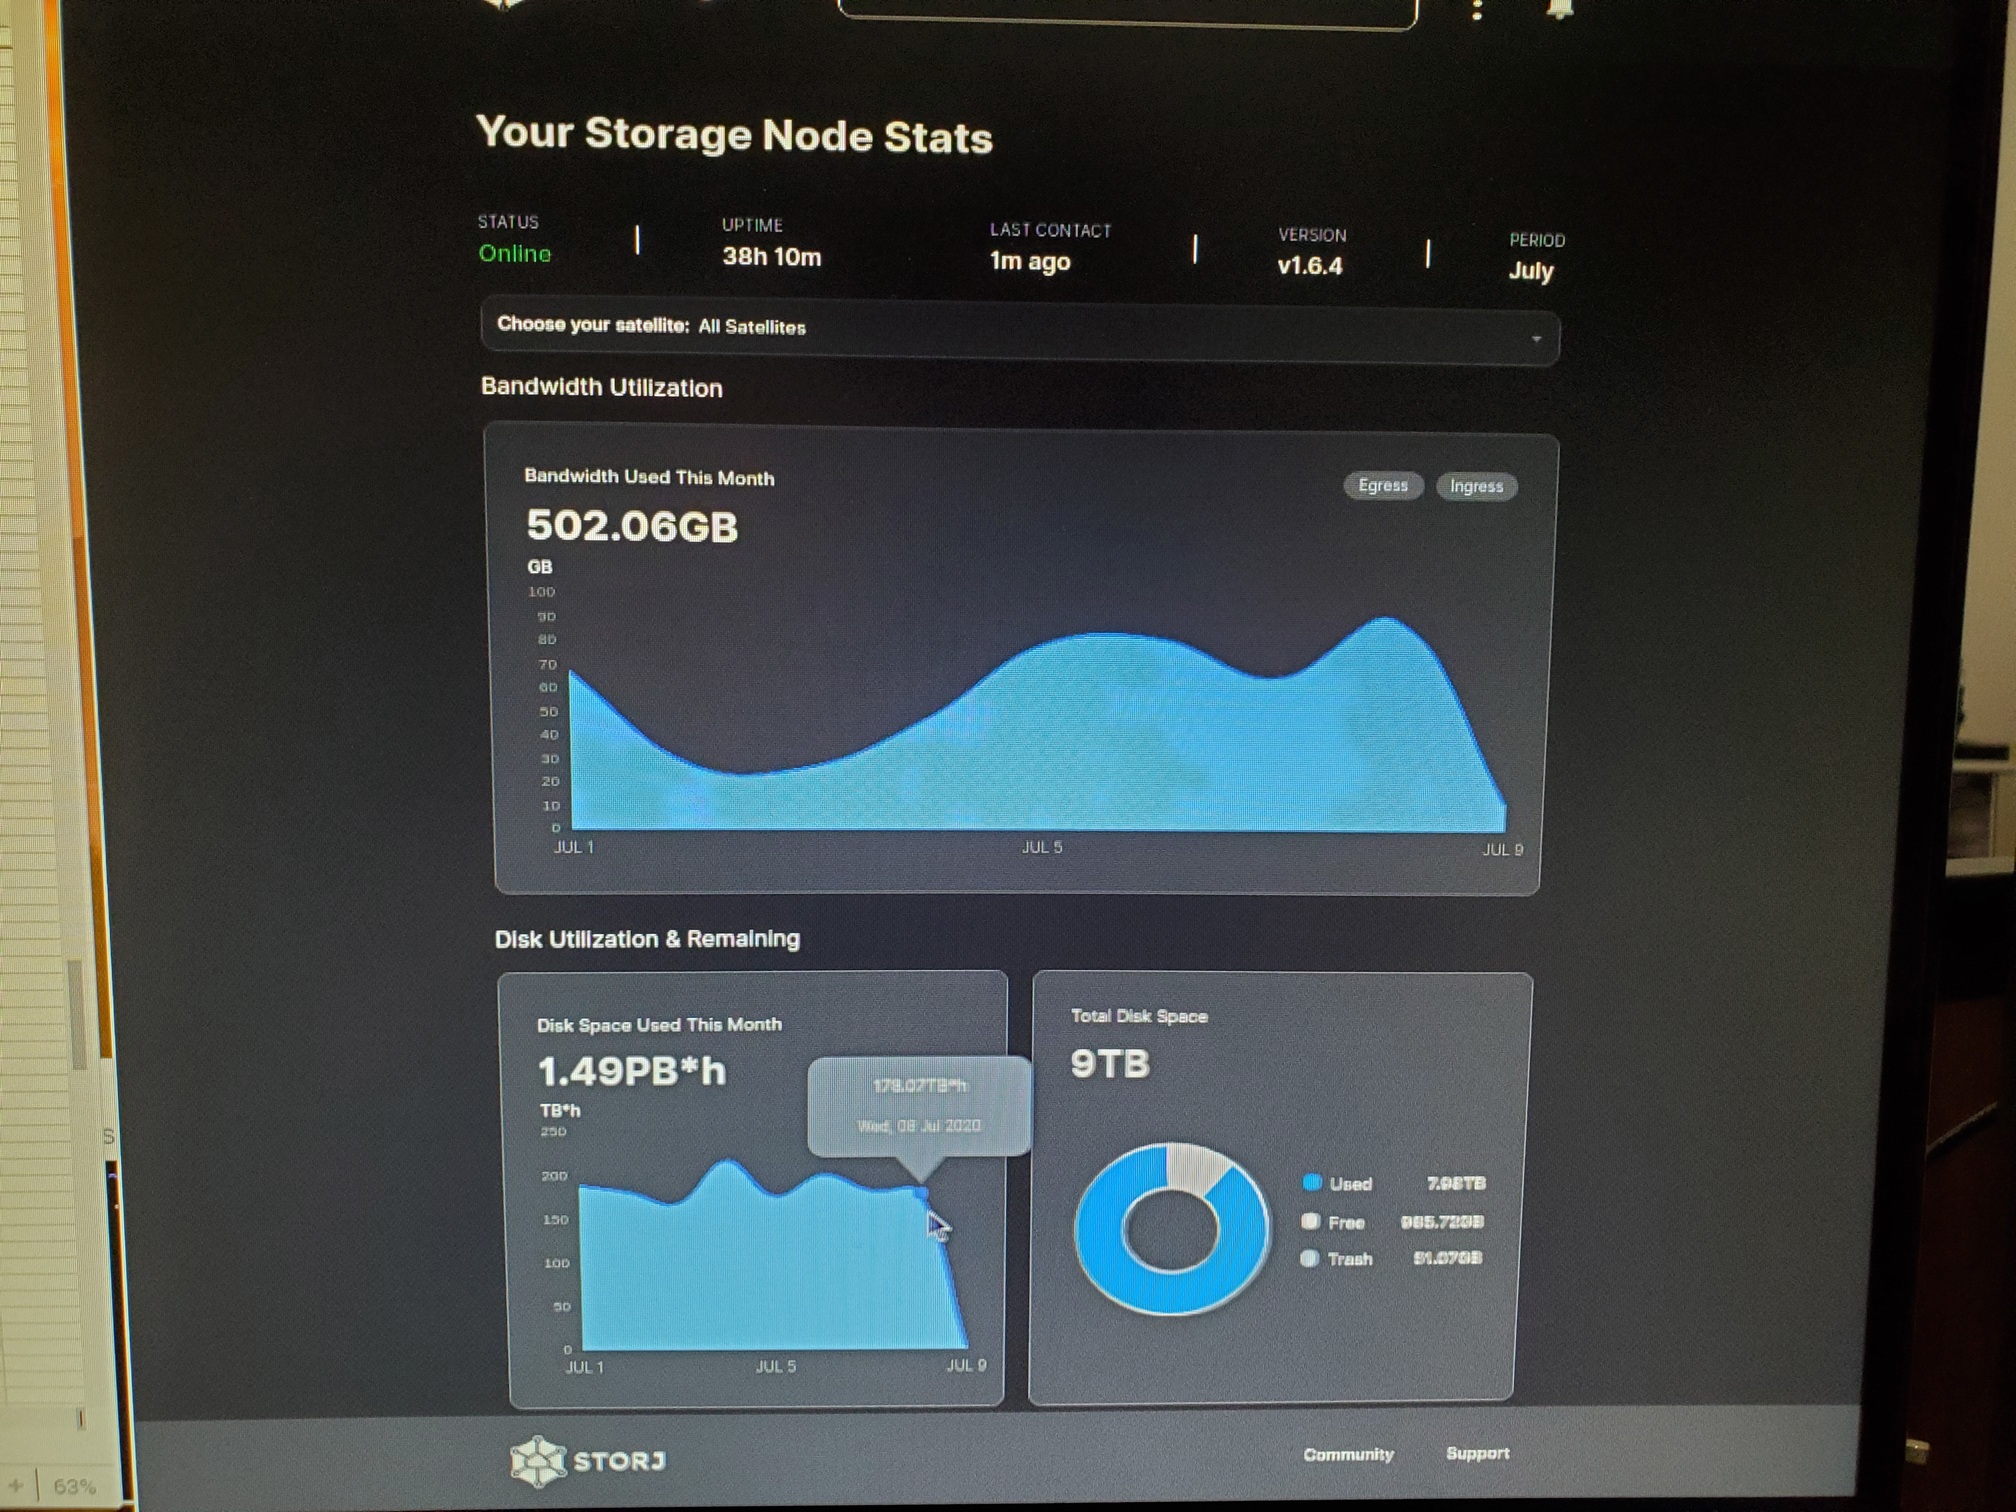
Not sure if the pictures are clear enough, since I still haven’t figured out how to screen grab those images with the daily pop up displayed, so I’ve resorted to taking a picture of the computer screen with my phone and then uploading those here. So here’s an excel table with the same data.
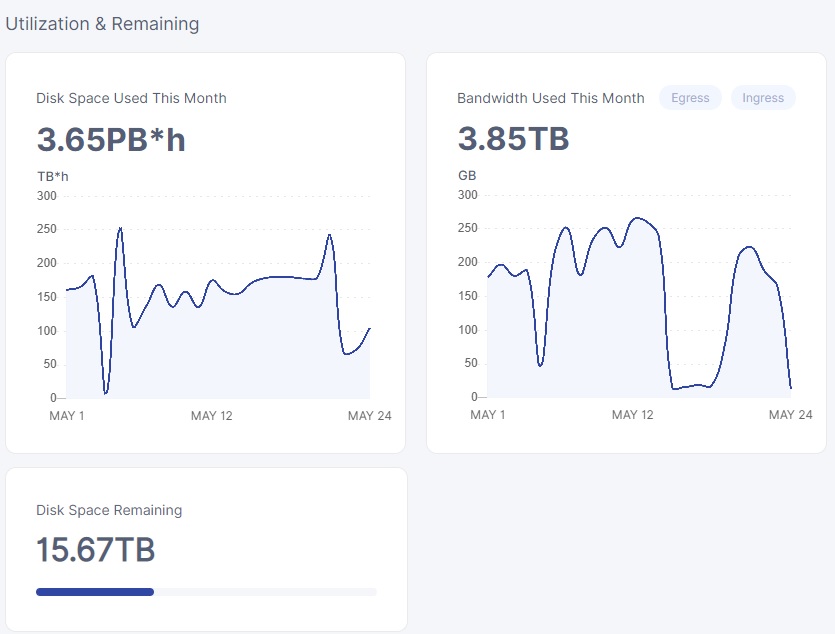
true but the daily space used is temperamental, some days i’ve had 3-6 TB variations, so i don’t really rely on that for anything… on avg i’m sure its right… but the graph is basically useless because it jumps around so much…
anytime you see a uptake in ingress, the disk space use graph will jump up like crazy and then after a few days drop again… maybe that is related to the stuff with the trash… that cancelled uploads gets stored at first and then deleted afterwards…
but that wouldn’t explain it either… like i said… i’ve had variation in that graph from day to day that was larger than what my internet bandwidth could sustain… but a sizable margin… and thus it has to be wildly inaccurate… atleast until they fix it… but i’m sure thats something they will be working on from time to time… seems better at the moment… it might also have been related to satellites being down… and thus maybe their live data feeds are somehow tied into the disk space used graph… would be weird… but i duno…
something surely makes the graph unstable.
had an image i saved of it… just look at it… from zero to hero in a day lol… 0 to 250TB*H
not sure if it still does this… but we haven’t seen high activity lately, which is when its worst… then ingress stops and starts at high speeds…
i think i actually read your data stored wrong yesterday… you also had significantly more egress there… going to go through and double check the numbers tomorrow and make a better list… maybe tonight…
maybe look into better capturing methods… so we don’t have to do this song and dance every day… pretty sure the basic layout of how we will do this isn’t going to change much from here… maybe add a deleted data also…
Also does anyone know if all the nodes are set on the same time zone ?
Because daily ingress and egress would change depending on the time zone the node is in…