I don’t know why people use ssd/nvme just for the database.
I have been running my node in some cheap harddrive that are about 10 years old in a 4x4TB raidz1 and I never had any problems with it.
On that same raid, I run other automated download on it, I never seen any node slowdown on it, or lost any data on it even with some random power off.
Right now nodes do perform sync after writing piece data. There’s an experiment running whether it makes sense for nodes to not sync them.
Power failure kills a marginal SSD. This could happen, I do not know how likely, but I can just add another SSD for SLOG and reduce the chance.
In my case (running a VM) the pool only sees sync writes (passed down from the VM). The node software itself does sync writes for new files (and IMO it is a good thing as I do not want to lose data after a crash) and probably some sync writes to the databases.
I think the thread derailed from the original discussion, which was how to copy entire node worth of data quickly.
In normal day to day operation nodes today see 1TB of writes a month. Give or take. So, under 400 kilobytes per second on average. Even array made of potatoes will be able to handle that. SDD zill? come on guys/gals. Measure first, buy overkill PCIE SSDs later. (Or, likely, never) ![]()
Fragmentation is likely not an issue whatsoever because reads are random. It does not matter whether you randomly read from a neatly sorted or unsorted dataset.
For the serializing writes performance wise – see excellent writeup by @IsThisOn above. on ZFS it’s already synchronized. And due to minimal amount of writes the experiment quoted above will likely be inconclusive.
Keeping sync however is useful for filesystems other than ZFS, and not just because of ZFS per se, but due to much higher likelihood of ZFS system being also on a UPS and more stable hardware than say some rpi with a desktop drive with huge cache.
I use 16G SLOG on my array due to it actually seeing predominantly sync writes. But not because of storj – even if storj does all writes in sync mode – there are so few of them that they are not visible on graphs.
Latency matters though, as some nodes will “lose the race” and will not get the piece. SLOG reduces the latency. Read cache (I do not use L2ARC, but my server has ~100GB of RAM) is also important, especially during the filewalker process or if the drives get IO load from somewhere else.
Copying the entire node to somewhere else would be fastest with dd, since it would copy the entire drive or partition without having to process each file separately. Of course this would work only if the destination drive is larger or the same size as source drive (even if there is a lot of free space).
… of synchronous writes, which disk array can handle on its own just fine due to very low IO pressure.
It’s entirely irrelevant from winning races perspective (those are random reads) and make no difference for file walker either for the same reason
uploads are races too.
As for filewalker - during that time, the hard drive IO load is high (reads), but that would also increase the latency for writes. SLOG should help minimize that.
But you don’t benefit from winning those races: you are paid for egress way more than for storage, and you are not paid at all for ingress. (winning slightly more upload races to grow stored data slightly faster and get slightly higher chances for more egress is secondary (or tertiary?) effect and can be ignored).
Filewaker applies such a large read pressure (in comparison) that offloading some writes to ZIL to SSD don’t matter much – precisely because there is very few of those writes. Writes are made in bulk (see transaction group) to the disk anyway, so SLOG does pretty much nothing – neither for read nor for write in this scenario.
It would have helped if you had a massive amount of synchronous writes the array could not handle – then offloading intent log would have relieved the write pressure somewhat. But this is not what happens with storj.
Speed race is hardly a thing here when I live in Australia and the closest node latency is around 150ms from Saltlake. The EU nodes are over 200ms. I doubt speeding up write or read times will win me any races.
I would suggest the best way to win races is to live in the same city as a node. A bit unfair but thats the way of it. ![]()
My node gets more data and with more data - more egress. Also, I read somewhere that if a node loses the upload race, it is less likely to be selected for the next segment. I do not know if that is true or not though.
It still may increase the latency enough for the node to lose some upload races. I do not know for sure though. I guess it would need some testing.
My pool only sees synchronous writes though (because the node runs in a VM).
Also, I was kind-of preparing for more traffic (what if this takes off?). There was one time in the past when my node saw 30mbps of ingress.
By the way, I run other VMs on that server too.
This is a very simplistic view of what a node does. Over the summer I managed to run some experiments trying to find out bottlenecks in node performance. I’ve took a log from a new node, roughly 3 weeks worth of operation, and wrote a Python script that would faithfully reproduce all I/O related to ingress, egrees, database writes and reads, some maintenance operations like a file walker, etc. I wrote some posts with results of these experiments: [1], [2]. One relevant number here is that the whole run took around 25 hours to reproduce the whole run.
I’ve also wrote a simplified path where the node just dumps all ingress into a single file and stores offsets+lengths for each piece in a simple file. I’ve reproduced reading from that file as seek+a single read call, and some basic file deletion in form of punching a hole in the file. Turned out, the same run now took below 3 hours.
So what is the node doing that took those 22 hours? Database writes and reads, maintenance operations like a file walker, some sync() calls to make sure data is there etc. Turns out, the way a storage node is implemented now, the bottleneck is not in sequential writes/reads, but in random IO. This basically means the 400 kBps figure is not very meaningful.
Now, the above experiments were performed on ext4. I’ve made another run on btrfs. This was terrible! I had to disable CoW to reach results in manageable time, and even then, instead of 25 hours, now I was getting 52 hours. Turns out, btrfs deals with random I/O very badly.
ZFS is also a CoW file system. ZFS has the advantage of having features that merge writes, so it would hopefully perform better than btrfs.
Now, is doing 3 weeks worth of I/O in 52 hours terrible performance? Well, the log was sourced from a period with less ingress than now—we probably experience the same I/O in a week or 10 days now. Also, 52 hours is a synthetic number measured in best possible conditions: I dedicated a full machine only for doing this tests, so no background tasks, no other services. The storage stack was also simplified: btrfs wrote directly on /dev/sda, no parity RAIDs, no LVM, no thin provisioning. And, from just a log file I couldn’t replicate traffic peaks when multiple connections compete for disk I/O, making the hard disk’s heads work even harder. In the past we have already noticed that there were situations in which btrfs was just too slow during traffic peaks, not being able to cope with traffic.
I have basically zero experience with ZFS, so I won’t claim caches and such are necessary. But by the results I’ve got, I find such claims made by other people plausible, especially if they want to take advantage of nice ZFS features like parity schemes.
How much space does the script use in total? Would you be willing to give it to me? I could run it on my server (ext4 + zfs) and see how it goes.
Does the script write random data to the “uploaded files”? If it just created files full of zeros, zfs would optimize that an compress it down to nothing.
You feed it node logs, all the upload started etc. entries. Whatever is in the logs, the script reproduces as I/O. So if you feed it longer logs, it will use more space. The drive I tested it on was 250 GB, and my test logs filled it.
I need to clean it up a bit, but yeah, I planned to publish it, together with some sample logs for reproducibility.
Would be great!
It pregenerates a buffer with fixed non-zero data, then fills each file with some part of that buffer. So not exactly zeros, but I suspect zfs may be able to deduplicate it.
I have read those posts in the past, very interesting, however in the context of the present discussion, this proves that there is 20x drive performance headroom even on ext4. Or 10x eve on untuned BRRFS (because btrfs can be tuned to perform just like ext4, but this is separate topic).
This is also not a surprise - you cannot control what customers read. I can’t think of what would generate sequential io in this scenario.
BTRFS tuning aside (disabling the checksums and perhaps even atime update, running the parity array and not LVM overlay; basically not Synology), that should bring performance on par with etx4. ZFS, as you have mentioned, would eliminate the peaks altogether.
Looking at network ingress on my (not very old, 4 month) node, after the first month the network stats look about the same, averaging 350kBps (both in and out) with peaks of up to 2.4Mbps, only visible when observed at 1 second averaging. At 1 minute averaging they max out at 900kbps, and averaged over an hour - 350kbps. (Meaning those peaks definitely would not matter with zfs transaction grouping, but also should not matter for all other filesystems – they are small and rare). I’m sure your dataset should show the same characteristics.
In the same time, various disk utilization stats, as reported by TrueNAS charts, show under 5% of disk utilization when server not doing anything else besides storj. Meaning there is 20x headroom. 20x! (And this is not even an optimized server - 4x 5400 drives, raidz1, system dataset on the same array, etc etc… I’d say it’s close to worse possible case)
Which is interesting, because it matches outcome of your experiments.
Granted, this node stores just under 2.5TB, egress may be higher when it gets up to 25, but still way under the headroom even if it grew linearly with the amount of data stored.
I came to the opposite conclusion: 400kbps random IO performance throughput is so low that it can be handled by any array directly absolutely effortlessly. Of course, if there were long 100Mbps spikes followed by hours of idle that also averaged 400kbps – that would have been a different story, but it is not the case here, storj traffic starts looking the same at about 3-5 minutes window averaging.
So far topics I have seen here that talk about abysmal performance were due to either almost full SMR drives on a low ram systems, or synology with low ram or untuned btrfs. Neither is surprising, and is very telling – any system shall be able to handle 400kbps of average random IO. If it does not – there is some glaring issue with it.
That’s why this whole thread amuses me – people talk about dual PCIE NVME SSDs to speed things up, while disk latency is not even a metric worth optimizing at today’s state of the network.
my 4tb smr drives start lagging in zfs raidz2 after ~1.5tb allocated. every txg commit bring pain ![]()
On my two year old node network stats look like this:

Sometimes there are spikes:
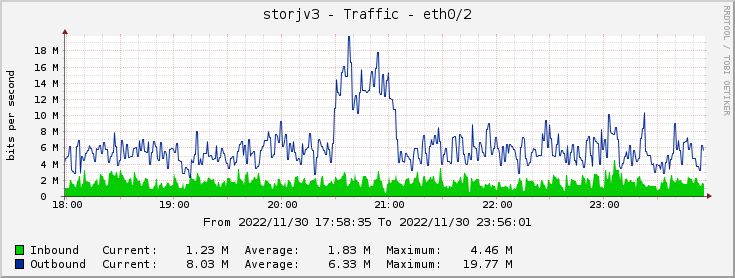

Apparently some eu1 customer wanted to download his files.
These are reads, of course, and SLOG does not accelerate reads.
There are also ingress spikes:


Maybe SLOG would help during those, or maybe the traffic is still not high enough to increase latency enough to require SLOG to win more races. The success percentage went down, would it have gone down even more without SLOG or stayed the same? I don’t know. Would it have been better with PCI-E SLOG instead of SATA? I don’t know.

The response time went up:

However, to be fair, at the time there was more read activity on the virtual disk (maybe filewalker or something):


Noting that traffic has almost doubled since my experiments, we’re already at 10× for ext4 and 5× for btrfs. Then you add CoW, which has additional overhead. Then you add traffic peaks, we’ve already seen peaks reaching double or triple the usual traffic. Then you add vetted traffic, as opposed to unvetted used in the experiments. All that puts us dangerously close to impacting latency. Applying the queuing rule of thumb, being within 50% of utilization already increases latency in a non-trivial matter.
Actually, if you have read my posts, you’d know that my experiments were done already with disabled atimes, checksums, parity, etc. Only when I disabled sync() after uploads I managed to get ext4 to be on par to btrfs, the corresponding change is under experiment by Storj now.
400kBps in 4kB writes would be 100 IOPS. HDD may have around 200 IOPS under some decent conditions (7200 RPM, so 120 rotations per second, a seek needs half a rotation on average). Oh, hey, look, 50% utilization! And then a spike comes, or maybe the garbage collector is invoked. Sometimes not even a Synology is necessary.
IOPS is not equal to IOPS, especially in hard drives. A 7200RPM hard drive can do 25k 4kB IOPS as long as all of the sectors accessed are one after another (linear access).
A 7200RPM hard drive can do 100-200 IOPS of pure random 4kB access, with a node that could happen, but is not very likely. Typically the pieces uploaded/downloaded are bigger than 4kB (on my node, the average uploaded piece size in the last 30 days was about 512kB) this makes it easier on the drives as one 512kB piece per second is much less random IO than 128 4kB pieces per second.
Great. Always sync-ing feels too conservative, expensive, and unnecessary (there is network redundancy and file walker on start to address abrupt reboots of nodes).
This would be true if IOPS on a filesystem level direclty translated to the same amount of physical IOps to the media, which is not the case at least on zfs: transactions are collected, batched, serialized, and flushed by default once every 5 seconds. Also, why are you using 4k writes as a reference? Was this the median block size on the dataset from your experiment? This sounds like too small, and unrealistic case.
From my node, right now only storj active:
kbps:

IOPS:

So at least here it seems the blocks are about 16k, not 4k. And I expect the disparity to be even larger with higher pressure. But lets se…
As long as they make it an option it would be OK. If they disabled sync on uploads and not made it configurable that would be a problem. I would not be too happy running a node with sync disabled (unless they also disabled audits ![]() ). Mounting the with the
). Mounting the with the sync option could help, but then it would make every write synchronous, even those that do not need it.

I probably should add something here, maybe dispersion or the median size.