Somebody unleash some Claud 3 opus agent to check all repos lol! heard its good in finding bugs!
I’d like to also ask for others to check if they have received US1 bloom filter these past few weeks on their large nodes. Me and one other person are sitting on weeks of garbage: Retain process is not running on my us1.storj.io node - #12 by DanielTB80
I received all bloom filters. They have been spread out nicely over the weekend. Monday morning logrotate archives my logs so the moment I think about checking the logs the current one will be empty.
2 Likes
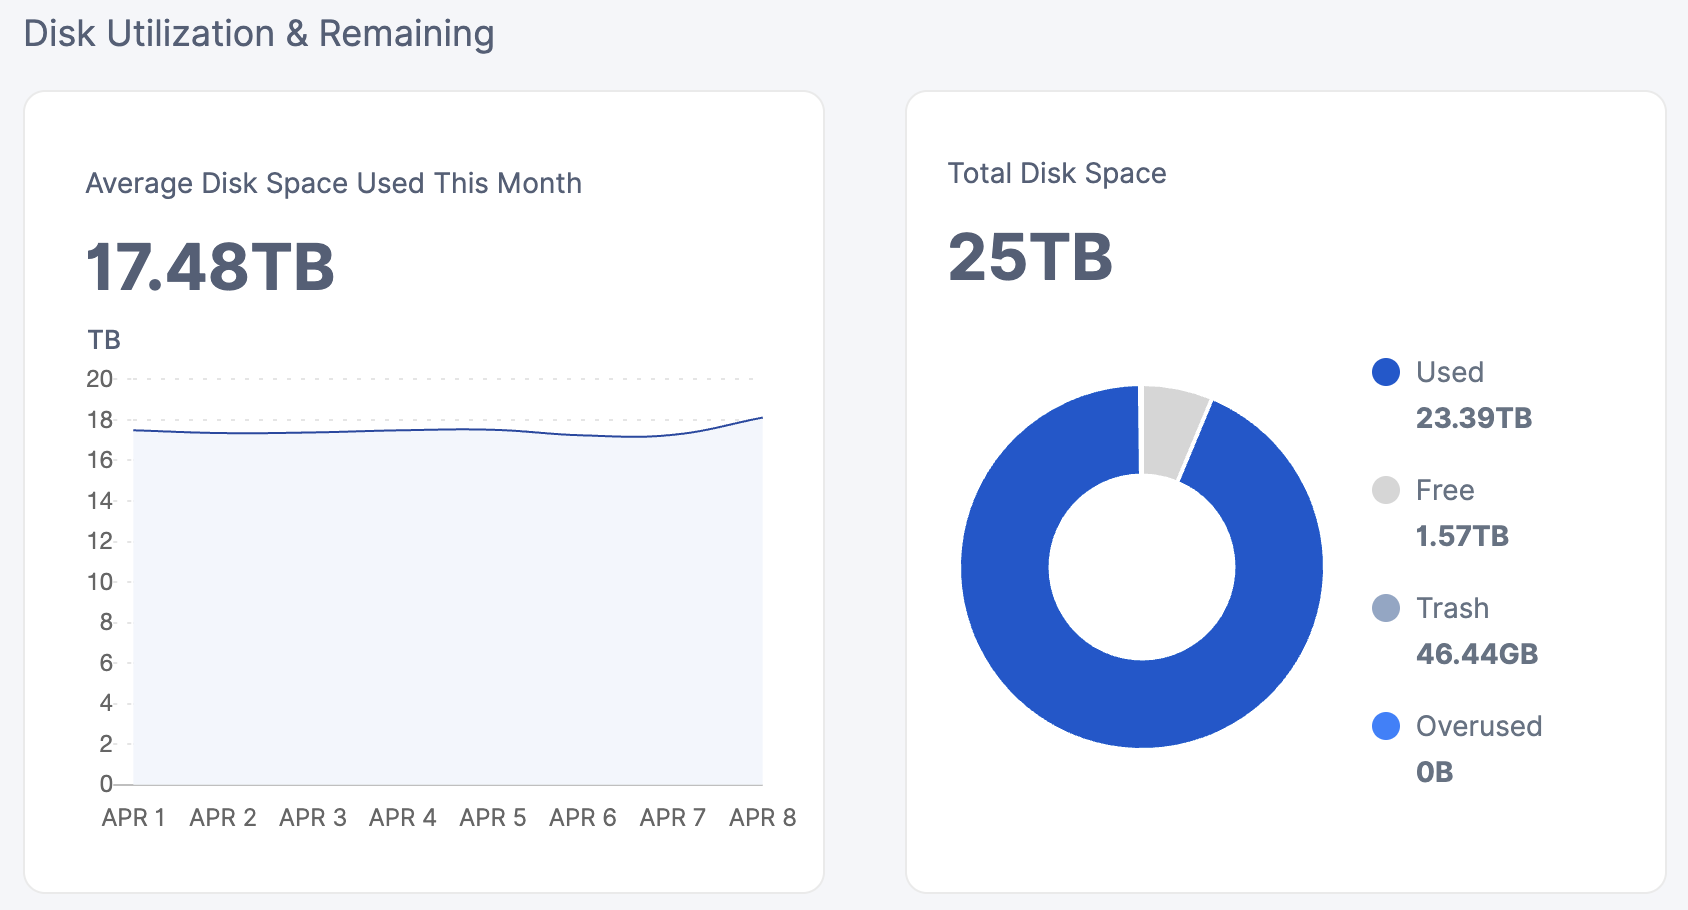
Here’s my two nodes.
Old one which looks good:
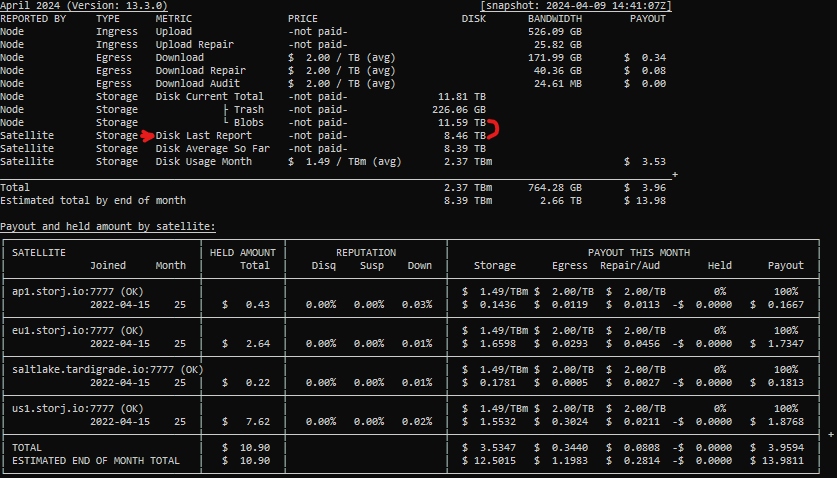
The newer one (but also old):
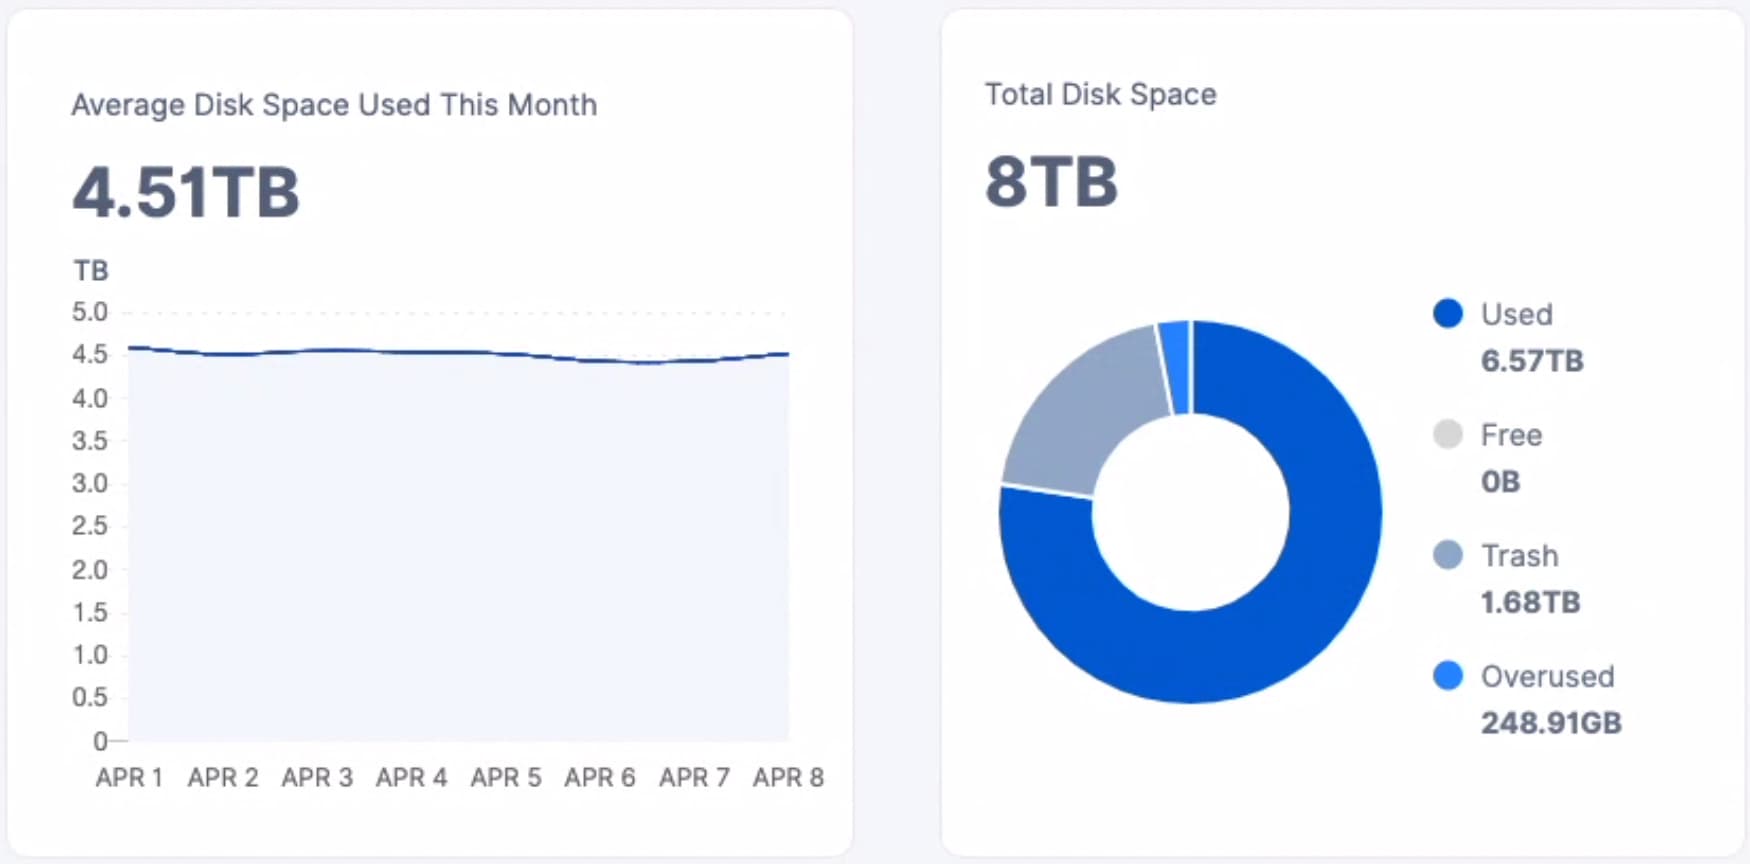
46 GB vs. 1.68 TB trash
What to do?
When’s the last time your large node had the gc-filewalker run? Even this past weekend it should have accumulated some large number of trash.
1 Like
That’s a good question - I don’t now. How do I check again, in the logs?
So is our assumption: the smaller node with 1.68 Trash piling up is more healthy than the other?
If you are using docker you can run
docker container logs storagenode-xxx 2>&1 | grep gc-filewalker
With a large node, the chances of you having 48GB of trash is unlikely, especially since there was a large exodus of manually deleted free-tier data. If your used-space filewalker correctly reports the 23.4 TB of used space, your node is carrying about 7TB of trash that should be removed.
2 Likes
Thanks … checked on my Synology in the logs and there’s nothing coming up with gc-filewalker but also no filewalker at all.
Using the docker command - same: results 0
But if I grep for other things I see in the log it works…
Looks like the file walker is not running at all? ![]() I’ve never changed any config except when the QUIC stuff was introduced IIRC.
I’ve never changed any config except when the QUIC stuff was introduced IIRC.
Can confirm, partially at least. I have most of this stuff in my earnings calculator as well. It’s not trivial, but I do feel like using binary units is a bit of a big oversight. That said, it does explain why my numbers didn’t match the web dashboard.
Edit: I should mention I only have to worry about the node side part and Storj Labs has to do the right thing end to end from satellite to node dashboard. Though from my experience the issues are mostly related to the node dashboard side.
1 Like
Is this supposed to be the case for all nodes? Because I still have a few with large discrepancies.
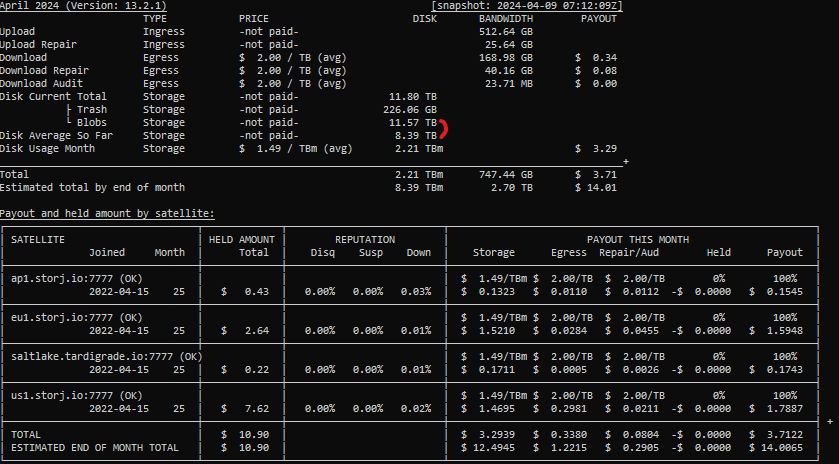
For context, I calculate disk average so far by selecting all intervals with an end date in the current month and summing the byte hours reported by the satellite. Then I calculate the number of seconds included in those reports and multiply the total byte hours by 3600 and divide by the number of seconds. All units are decimal.
- Disk Average So Far = (Total Byte Hours * 3600) / Total Seconds Reported On
Disk Current → Blobs is just piece space used total excluding the trash line in the db.
@Frosty81 : pinging you because I said in the earnings calculator topic that I didn’t see such big discrepancies. But clearly I do. So I’d like to correct that statement.
1 Like
I did this fancy math at first as well just to find out that the storage node is doing that for me already. Take a look at /api/sno/satellite/12EayRS2V1kEsWESU9QMRseFhdxYxKicsiFmxrsLZHeLUtdps3S (and all the other satellite IDs. You will find a result like this:
{
  "id": "12EayRS2V1kEsWESU9QMRseFhdxYxKicsiFmxrsLZHeLUtdps3S",
  "storageDaily": [
    {
      "atRestTotal": 34212032305784.9,
      "atRestTotalBytes": 1629144395513.57,
      "intervalInHours": 21,
      "intervalStart": "2024-04-01T00:00:00Z"
    },
[...]
    {
      "atRestTotal": 36745048766109.8,
      "atRestTotalBytes": 1837252438305.49,
      "intervalInHours": 20,
      "intervalStart": "2024-04-08T00:00:00Z"
    },
    {
      "atRestTotal": 19152409068565.6,
      "atRestTotalBytes": 1915240906856.56,
      "intervalInHours": 10,
      "intervalStart": "2024-04-09T00:00:00Z"
    }
  ],
  "bandwidthDaily": [
[...]
From this list take the latest result. Yesterday I had no result on EU1 so in that case just pick the day prio. In my case that would be 19 152 409 068 565.6 ByteHours / 10 Hours = 1 915 240 906 856.56 Bytes. You can skip the math and use atRestTotalBytes here. That is what the satellite has seen and is going to pay me for. There are maybe some rounding errors involved because it could be 9.5 hours. On the other hand I don’t see any evidence that there are error like that. It might get normalized on the satellite side or some other magic trick like that. Anyway the point is In my case that number was very close to my used space on disk. Close enough to make me believe the value is correct. On 4 TB used space I have just 150 GB of unpaid and not yet detected garbage. And that value is including the new uploads I received between yesterday (data point from the satellite side) and my current used space on disk the moment I run this math.
1 Like
I appreciate that, but the whole point of having a separate earnings calculator is to not rely on the existing calculations in dashboard/API, but verify as much as possible by calculating from the most raw data I can get. And I can get the API data from the dashboard as well, which for this node shows the same issue.
Even if that is binary vs decimal, it’s a big gap.
The storage_usage.db has intervals that don’t align with full days like the API calculates, but rely on to the nanosecond(overkill?) precision. So there is already a lot of hidden logic in those daily summaries, which I’d rather verify with my own calculations as well. This also allows me to avoid the rounding errors you mentioned. I’m not a big fan of how the dashboard relies on daily calculations which are then summarized into the monthly average, with rounding errors on both levels.
However, I do realize that it might be useful to add a metric that includes bytes stored based only on the last report from the satellite, to get insight in what the most recent report shows and eliminate the average over the month effect. I’ll look into how I can incorporate that. That said, no matter what metric I look at, this node (and at least one other one I host) still has a big difference between paid data stored and total amount of blobs data.
1 Like
Bigger nodes will still be affected by the limited bloom filter size. (See number 3 from the original list)
You can spot it in the logs:
2024-04-06T06:14:24+02:00 INFO retain Prepared to run a Retain request. {"Process": "storagenode", "cachePath": "/mnt/sn1/storagenode1/storagenode/retain", "Created Before": "2024-03-27T17:59:59Z", "Filter Size": 2277668, "Satellite ID": "12EayRS2V1kEsWESU9QMRseFhdxYxKicsiFmxrsLZHeLUtdps3S"}
In my case the filter size is about 2 MB. I am holding ~8 Million pieces or 2 TB used space for this satellite. I believe the current limit is 4 MB. So based on my numbers I would estimate that any node that is bigger than 8 TB (2 satellites with 4 TB each) will start to see a higher false positive rates.
The fix is already developed. The current plan is to just wait until all nodes updates to the new version and at some point switch it on. There is an option to speed this up but it would be more expensive for us to implement it. So as long as it affects only a few nodes I would prefer to ask for patience in order to spend our resources on making more customers happy.
2 Likes
Oh and one more question. Has this node already received all bloom filters last weekend? Can you maybe grep the corresponding log lines for me? I have seen nodes that need days to run garbage collection.
1 Like
So far it has been expensive for the SNOs…
2 Likes
Looks like it hasn’t received a bloomfilter from 12EayRS2V1kEsWESU9QMRseFhdxYxKicsiFmxrsLZHeLUtdps3S since the 2024-03-01. And that one was 4100003 bytes, so likely hit the max size. So I guess I’ll wait?
2024-03-01T15:39:51Z    INFO    retain  Prepared to run a Retain request.       {"process": "storagenode", "Created Before": "2024-02-21T17:59:59Z", "Filter Size": 4100003, "Satellite ID": "12EayRS2V1kEsWESU9QMRseFhdxYxKicsiFmxrsLZHeLUtdps3S"}
2024-03-03T08:18:20Z    INFO    retain  Prepared to run a Retain request.       {"process": "storagenode", "Created Before": "2024-02-27T17:59:59Z", "Filter Size": 3071092, "Satellite ID": "12L9ZFwhzVpuEKMUNUqkaTLGzwY9G24tbiigLiXpmZWKwmcNDDs"}
2024-03-07T15:11:13Z    INFO    retain  Prepared to run a Retain request.       {"process": "storagenode", "Created Before": "2024-02-17T13:02:55Z", "Filter Size": 122108, "Satellite ID": "1wFTAgs9DP5RSnCqKV1eLf6N9wtk4EAtmN5DpSxcs8EjT69tGE"}
2024-03-08T14:07:11Z    INFO    retain  Prepared to run a Retain request.       {"process": "storagenode", "Created Before": "2024-03-04T17:59:58Z", "Filter Size": 505495, "Satellite ID": "121RTSDpyNZVcEU84Ticf2L1ntiuUimbWgfATz21tuvgk3vzoA6"}
2024-03-10T04:29:35Z    INFO    retain  Prepared to run a Retain request.       {"process": "storagenode", "Created Before": "2024-03-05T17:59:59Z", "Filter Size": 3077222, "Satellite ID": "12L9ZFwhzVpuEKMUNUqkaTLGzwY9G24tbiigLiXpmZWKwmcNDDs"}
2024-03-14T21:01:25Z    INFO    retain  Prepared to run a Retain request.       {"process": "storagenode", "Created Before": "2024-02-17T13:02:55Z", "Filter Size": 122398, "Satellite ID": "1wFTAgs9DP5RSnCqKV1eLf6N9wtk4EAtmN5DpSxcs8EjT69tGE"}
2024-03-15T15:51:03Z    INFO    retain  Prepared to run a Retain request.       {"process": "storagenode", "Created Before": "2024-03-11T17:59:59Z", "Filter Size": 508031, "Satellite ID": "121RTSDpyNZVcEU84Ticf2L1ntiuUimbWgfATz21tuvgk3vzoA6"}
2024-03-17T04:08:28Z    INFO    retain  Prepared to run a Retain request.       {"process": "storagenode", "Created Before": "2024-03-12T17:59:59Z", "Filter Size": 3143729, "Satellite ID": "12L9ZFwhzVpuEKMUNUqkaTLGzwY9G24tbiigLiXpmZWKwmcNDDs"}
2024-03-28T19:28:12Z    INFO    retain  Prepared to run a Retain request.       {"process": "storagenode", "Created Before": "2024-02-17T13:02:55Z", "Filter Size": 123500, "Satellite ID": "1wFTAgs9DP5RSnCqKV1eLf6N9wtk4EAtmN5DpSxcs8EjT69tGE"}
2024-03-29T19:32:27Z    INFO    retain  Prepared to run a Retain request.       {"process": "storagenode", "Created Before": "2024-03-25T17:59:59Z", "Filter Size": 455800, "Satellite ID": "121RTSDpyNZVcEU84Ticf2L1ntiuUimbWgfATz21tuvgk3vzoA6"}
2024-03-31T06:36:16Z    INFO    retain  Prepared to run a Retain request.       {"process": "storagenode", "Created Before": "2024-03-26T17:59:59Z", "Filter Size": 2946586, "Satellite ID": "12L9ZFwhzVpuEKMUNUqkaTLGzwY9G24tbiigLiXpmZWKwmcNDDs"}
2024-04-04T21:04:39Z    INFO    retain  Prepared to run a Retain request.       {"process": "storagenode", "Created Before": "2024-02-17T13:02:55Z", "Filter Size": 124715, "Satellite ID": "1wFTAgs9DP5RSnCqKV1eLf6N9wtk4EAtmN5DpSxcs8EjT69tGE"}
2024-04-05T16:48:16Z    INFO    retain  Prepared to run a Retain request.       {"process": "storagenode", "Created Before": "2024-04-01T17:59:59Z", "Filter Size": 467874, "Satellite ID": "121RTSDpyNZVcEU84Ticf2L1ntiuUimbWgfATz21tuvgk3vzoA6"}
2024-04-07T08:21:35Z    INFO    retain  Prepared to run a Retain request.       {"process": "storagenode", "Created Before": "2024-04-02T17:59:59Z", "Filter Size": 3013598, "Satellite ID": "12L9ZFwhzVpuEKMUNUqkaTLGzwY9G24tbiigLiXpmZWKwmcNDDs"}
Btw, are the large gaps between the log timestamp and the “Created Before” normal? And what does that gap signify?
1 Like
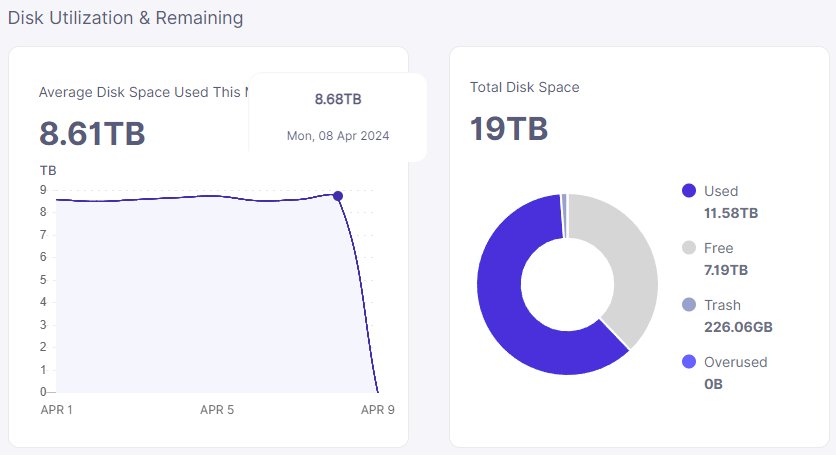
Thanks for this idea, @littleskunk. Implemented total disk stored based on last report from the satellite (raw last time window, not last day like in the dashboard/API) in a prototype version of the earnings calculator. Will release soon after a little more testing. I also added which values are reported by the node vs satellite.
I’m not entirely sure why my calculation leads to a significantly lower number than 8.68TB shown on that last day on the dashboard, especially if that is supposed to be TiB. But since I literally just calculate byte hours*3600/number of seconds for the last window, I think my method is a lot less convoluted and should be correct.
1 Like
I cannot imagine given the current excess of storage or SNO’s for that matter Storj particularly cares about that in any way.
I don’t know if they don’t care. Maybe they have no idea.
But it is obvious: If you have a node, that claims to be 100% full but you only get 50% paid, because Storj has introduced a garbage collection process that is not working correclty and leaves you with 50% unpaid trash, that does not get collected, then you are pretty much arsed. The node is full and does not get any ingress and you get only paid 50% of storage that you are effectively providing.
They should care about that and it is concerning that there is no official statements, apology or compensation offer from some of the higher ranks.
5 Likes
I wonder if any of Storj dev team has 20+ TB drives running storagenodes? So far I saw some talking about their nodes of 1-2-3TB which work great. If we weren’t complaining, they wouldn’t had a clue about problems with big nodes.
How can you develop a service like this and you don’t have the hardware to test it? And not just one… they should run storagenodes on Linux and Windows too, docker and non-docker, on the biggest drives that pops up on the market in a period of 3-4 years.
There are like 60+ employees. Enough different IP’s for running test nodes.
4 Likes