x2 sites. Both Nodes (we will call Site A and Site B) on unRAID running with Docker; data in their own drive pools…no changes on either (besides normal reboots, server and container updates, as per-usual). They are still on V. 1.66.1 (according to logs). They are set up to always auto update. Sites are on static IP’s from ISP.
- Both sites started throwing this in logs; first Site A, then Site B:
“ERROR piecestore failed to add bandwidth usage {“Process”: “storagenode”, “error”: “bandwidthdb: database disk image is malformed”, “errorVerbose”: “bandwidthdb: database disk image is malformed\n\tstorj.io/storj/storagenode/storagenodedb.(*bandwidthDB).getSummary:171\n\tstorj.io/storj/storagenode/storagenodedb.(*bandwidthDB).Summary:113\n\tstorj.io/storj/storagenode/storagenodedb.(*bandwidthDB).Add:52\n\tstorj.io/storj/storagenode/piecestore.(*Endpoint).beginSaveOrder.func1:731\n\tstorj.io/storj/storagenode/piecestore.(*Endpoint).Download.func6:670\n\tstorj.io/storj/storagenode/piecestore.(*Endpoint).Download:694\n\tstorj.io/common/pb.DRPCPiecestoreDescription.Method.func2:228\n\tstorj.io/drpc/drpcmux.(*Mux).HandleRPC:33\n\tstorj.io/common/rpc/rpctracing.(*Handler).HandleRPC:61\n\tstorj.io/common/experiment.(*Handler).HandleRPC:42\n\tstorj.io/drpc/drpcserver.(*Server).handleRPC:122\n\tstorj.io/drpc/drpcserver.(*Server).ServeOne:66\n\tstorj.io/drpc/drpcserver.(*Server).Serve.func2:112\n\tstorj.io/drpc/drpcctx.(*Tracker).track:52”}” Constantly;
and occasionally, i get this at both sites:
“ERROR bandwidth Could not rollup bandwidth usage {“Process”: “storagenode”, “error”: “bandwidthdb: database disk image is malformed”, “errorVerbose”: “bandwidthdb: database disk image is malformed\n\tstorj.io/storj/storagenode/storagenodedb.(*bandwidthDB).Rollup:324\n\tstorj.io/storj/storagenode/bandwidth.(*Service).Rollup:53\n\tstorj.io/common/sync2.(*Cycle).Run:99\n\tstorj.io/storj/storagenode/bandwidth.(*Service).Run:45\n\tstorj.io/storj/private/lifecycle.(*Group).Run.func2.1:87\n\truntime/pprof.Do:40\n\tstorj.io/storj/private/lifecycle.(*Group).Run.func2:86\n\tgolang.org/x/sync/errgroup.(*Group).Go.func1:75”}”
-
Site A started having issues before Site B, and showed lower then 100% suspension scores. It seems to have resolved itself, after a 2 or 3 days (for the most part), and only rarely throws the “error peicestore” or “Could not rollup bandwidth usage” message in the log any longer; the suspension scores have returned to 100%. Site A never showed any QUIC errors, or offline during its trouble.
-
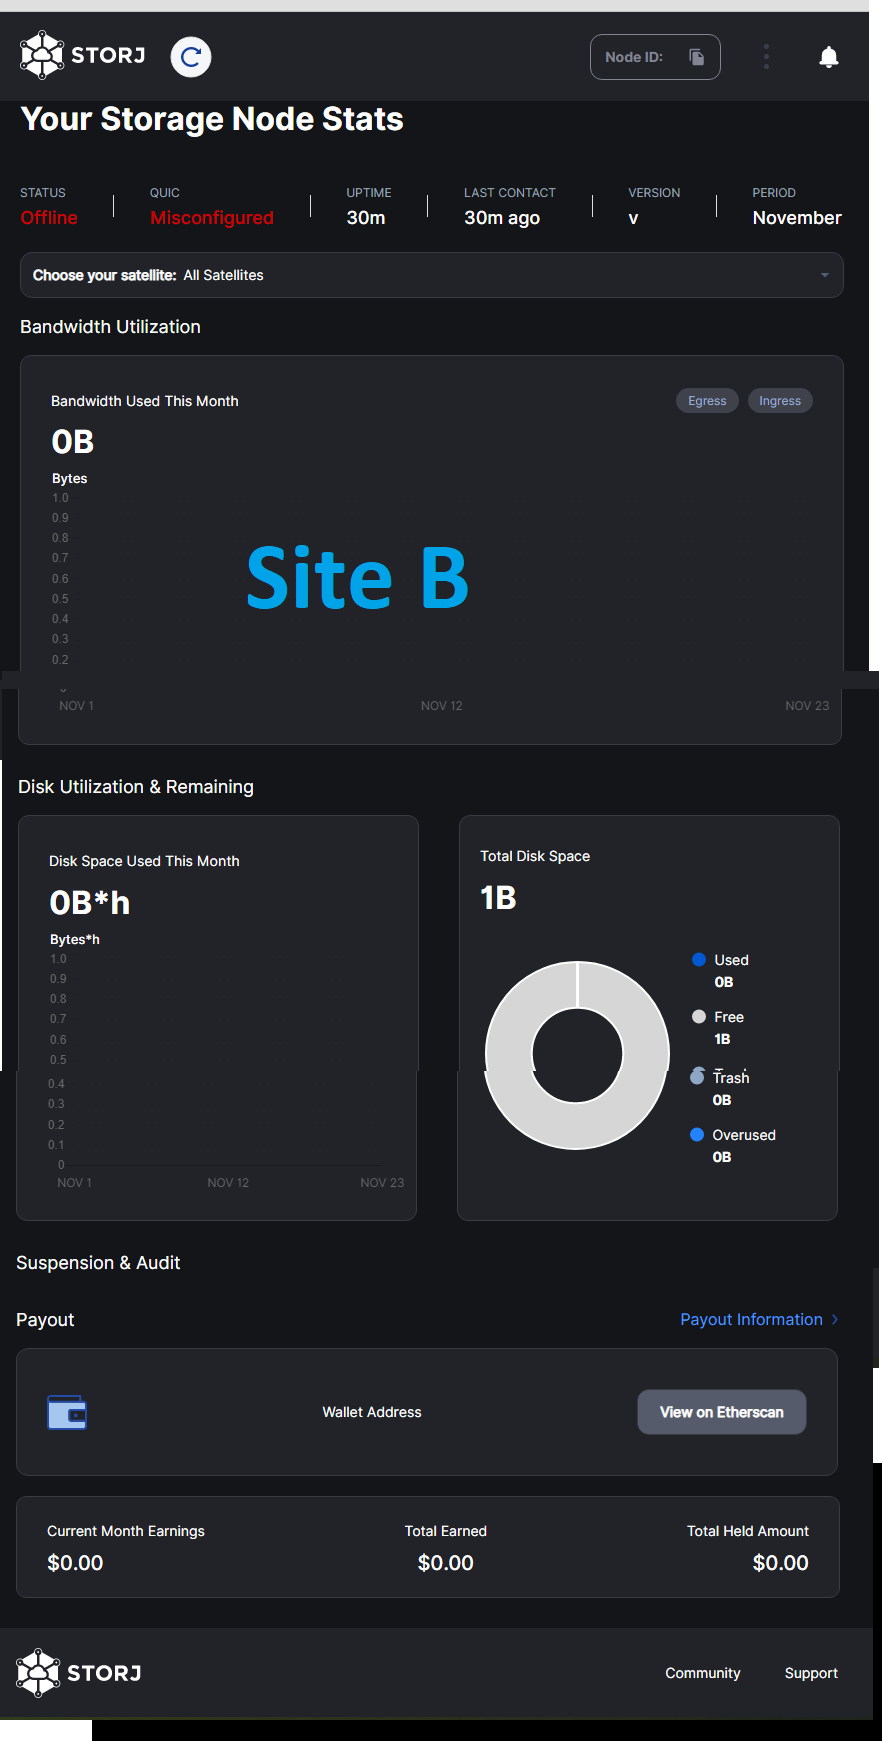
Site B was running smoothly (during Site A’s issues), until a standard server restart was performed. Now Site B has the constant “error peicestore” and occasional “Could not rollup bandwidth usage” errors (although it seems to still be uploading/downloading from satellites, in the log, between errors, and constant read/write disk activity as normal), BUT the Node Dashboard also shows offline, QUIC misconfigured, no Node ID is shown in the Dashboard, and all the stats on the main page are wrong (although the payout info seems to still exist; unknown if its correct or not) (see screenshot). I am extremely worried about losing this node, as it is the one with the most space and activity (with plans on adding a large amount of more space soon)!
I have not touched ANYTHING on either STORj Node Sites since these errors started, other then server and network equipment reboots, confirming the ports are (still) open, and the drives are all in good health! Prior to this, they have been running trouble free for 6 and 9 months respectively!
Site A’s issues seems to be different but similar to Site B. Site A seems to have gone back to trouble free working order, except for the rare “error peicestore” error, and “Could not rollup bandwidth usage” if i restart it.
Please help! It seems that it has happened since the latest version rollout? Will there be any amnesty to our reputation scores, as it seems to be out of our control or anything we have done as operators?

UPDATE: in trying to resolve this ongoing issue, I have been comparing settings for both sites (matching the working A to B etc). I have noticed that, even tho Site A seems to be performing properly, at start up the log shows a number of “ERROR piecestore”, then one “ERROR bandwidth”, errors before, seemingly, settling into the normal download/upload logs (“GET” and “GET_REPAIR” info lines) that i am used to seeing. […but, curiously, no “PUT”; i suspect that is due to the allotted disk space being full till i can get bigger drives]
…just thought this might be of some use to a dev who is reading this. (Site B is still having major issues as described above)