I don’t think it’s a dashboard problem. Dashboard is using API for rendering data, the same API used for payouts calculations and everything. The problem is that satellites just see 5% of my space allocation online. And that is the space I will be paid for.
I have 3TB constantly online, but satellites see just 3TB for 2hr day (6TBh) instead of 3TB for 24h/day (72TBh).
This will heavily affect payments.
cool, thanks for the reply, appreciate it.
I’m seeing this drop as well on my side, and it’s not caused by vetting process according to earnings calculator:

Sudden drop in demand:

To be honest, I don’t trust the dashboard.
I’m collecting stats in Zabbix for all of my nodes and here is 7 days of egress traffic for one node:

7 days of storage on the same node:

This is fairly representative of all of my nodes. Some have been around since last year and two of them I started running last month.
The dashboard paints a totally different story for this node:
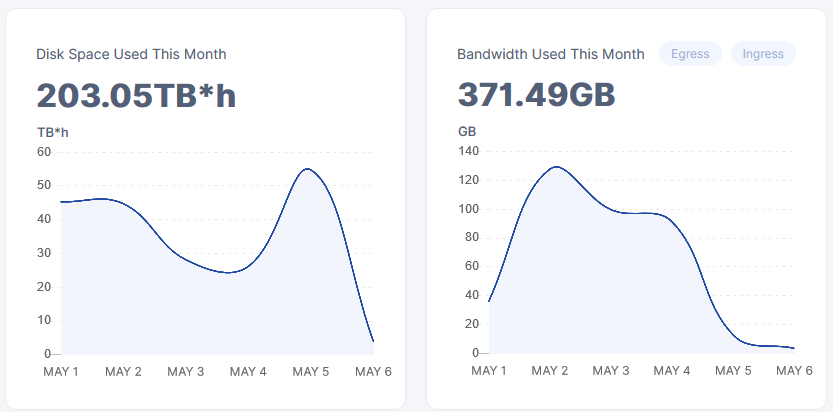
Both of these cannot be true at the same time, and I trust Zabbix’s historical data collection way more than storagenode’s – it is significantly more field-tested, and I have it set to capture a sample once per minute.
From what I’ve seen around the forum, storagenode collects a sample of timed storage usage twice per day (unless that changed in v1.3.3) which can result in significant variation in the displayed data where no such variation actually exists. I don’t know if there is a similar issue with ingress/egress usage.
I it just me or is it like the numbers for the deletions came in on the dashboard graph before on my actual system…
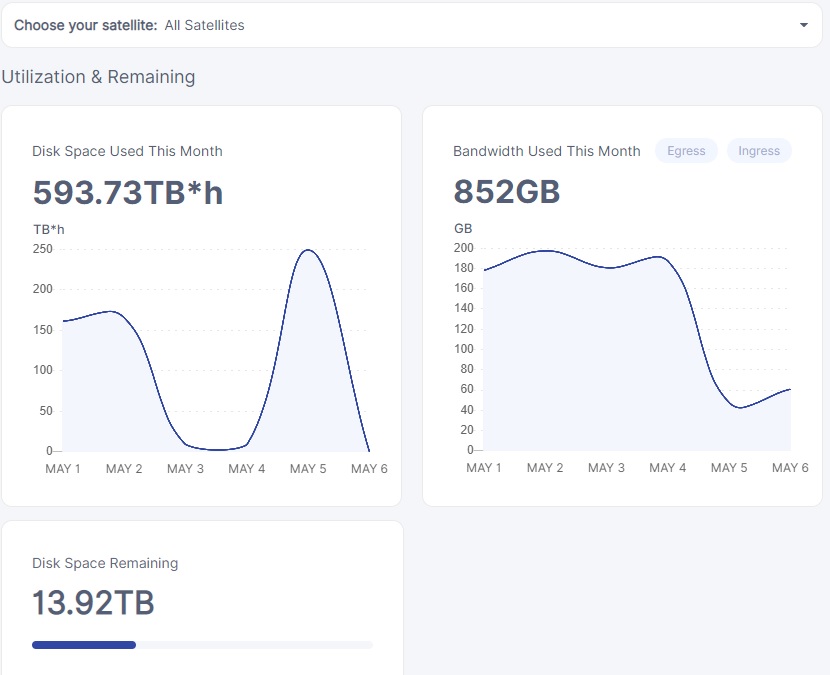
and now i get a graph after two days of near zero at 250TB*h, which doesn’t make any sense i got atleast 5tb… even now i got 5tb
and don’t tell me it’s deleted, because it isn’t at the speed thats being deleted its barely deleting anything at all … so far today its deleted 150k files thats only like 300gb and i have like or had like 6tb
so at current speed it will take 3 days to get below 5tb
so i should get atleast + 120TBh which seems right for the two first days.
then it drops to 9 or 8TBh pr day, which to me seem like somebody is basically just sitting there putting in numbers… like the system reacted immediately to the data being deleted in the statistics, but the satellites taking a week to delete it all…
and now it jumps back up… to 250TB… looks very very weird…
i mean if the system was adding it all up and the error was fixed, then it should give 3 days in one… but it didn’t it gave me 2 days in one, which means tomorrow it should also give me 2 days in one, to catch up…
but that makes it seem like somebody actually decided the graph should move like that because of people yelling out at large swings…
i’m not saying it’s anything nefarious, nor means anything… just looks odd to me… makes me think there is a wizard of oz…
In my opinion
The saltlake satellite has been adding data at a huge rate. The process that counts up the storage used runs twice a day but has been getting longer and longer runs.
At some point (end of April) this became significant and runs started overlapping, this in turn caused the next run to take longer and longer until, May 3rd, no run were able to complete.
The storj response has been to stop uploading and to delete a lot of the little pieces that make up the data on storagenodes.
So you will see lots of little deletes for May 5th on.
No your node has not deleted TBs of data, yes the graph is out of date.
Pay will be calculated from the data not the graph.
/ In my opinion
i was saying it looks odd that the graph adjusts to whats going to be deleted on my node before it’s actually deleted… and then a bit of ramblings xD
i’m not worried, this is a perfect time for me to move my node yet again and maybe repair my server while the node will fit on my smaller computer.
aside from that this is great for testing how well everything operates, comparing with idle use cases with some … i don’t want to say high activity but highest activity i’ve seen thus far anyways…
i don’t expect us to be able to perform such tests in the future as the network will be more active all the time… and then we are stuck with guessing and what we can gauge from a network for a more consistent load.
and in regards to the pay… well not like i’m actually making any money on this yet hehe xD
the graph is just like ahead, when it should be behind… thats odd
Yes, I’ve noticed your posts are quite long ![]()
Are you N1 by the way?
Hi,
Disk space used for one of my Storage node (hosting ~2.5-3TB of data) fell down from 75 TBh to 750GBh.

Is that normal?
If I well understand this diagram, it means that a lot of data have been erased on my node and then a lot of new data has been uploaded to it the next day.
Should I be worried about my node health?
Thanks for your help
No your node is probably fine. Check some other threads for full story but saltlake go a bit slow accounting
Thank you, I’m reassured ![]()
In my opinion, the graph for TB*h is the projection of my allocation on the satellite, meaning that file piece must be present in my storage AND must be pointed by the satellite. If the satellite removes the pointer to my file, the piece and its allocation disappears from graphs instantly (and, in my opinion, from payments). The physical deletion of the file piece from my storage is asynchronous and will happen later.
I think that satellites in the past days removed all test data, causing allocation-projection drop, meaning I have now tons of orphan data, not pointed by satellites, not counted in graphs, not counted in payments, that slowly will get deleted in future days.
Just my thoughts.
This didn’t happen. It’s merely a reporting issue. TBh is reported back to the nodes by the satellite after calculation is done. This process saw some delay, which is why you’re missing some data.
Additionally, when files are deleted and your node is online, those deletes will be passed on to your node right away. The only way garbage collection will have to kick in is when your node wasn’t online during the deletion of data or for some reason timed out on the initial deletion of data.
Thanks all!
So I suppose it’s also normal if I see my “Disk Space Remaining” being progressively higher day after day?
I would like to make sure that my node is not emptying out because of a problem on my node…
Just check the logs and make sure that uploads are still occurring along with audits and that you aren’t suspended on any satellites and that should be the easiest way to verify.
Yes. Saltlake is removing some test data, but it hasn’t removed all of it (yet, anyway).
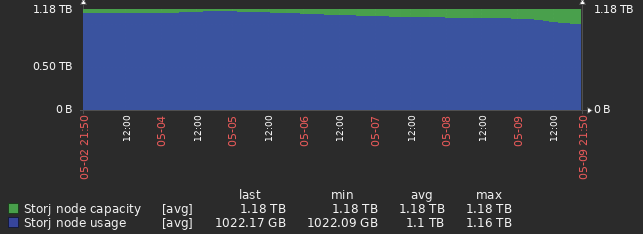
One of my nodes’ storage usage over the last week:
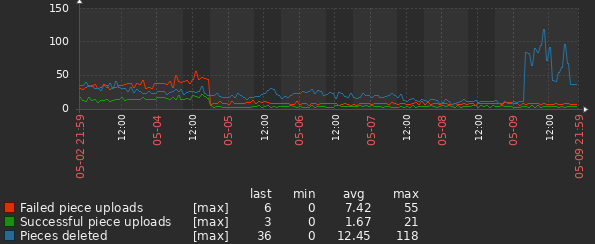
This node’s upload/deletion requests over the same time range (note the sharp increase in deletions in the past ~day):