Don’t worry about that. I’m running a four-drive NAS with all drives for storage nodes on a proudly named “AMD Athlon™ II Neo N36L Dual-Core Processor”, which is like 10% of what you have. And I still have spare processing power there.
You’re right. I’m more worried when I see “user 1%; system 2%; I/O wait 80%”…
So, you basically suggesting to implement an rsync? I will vote against that.
If you want to - you may easily script this.
The storagenode binary must not include any system tools, such as monitoring with Prometheus and Grafana, containers management, rsync, sqlite fixing, filesystem fixing, S.M.A.R.T. analyzer, RAID any kind, firewall management and so on. It should do only what is it designed for - store and provide encrypted data. Everything else should be implemented externally.
I am not a programmer, I don’t know how things can be done. I’m against that too. Storagenode binary must stay free of third party code. I imagined something like storagenode calling the rsync service/exec that is already installed in the OS to do the job. And I wasn’t sugesting implementing monitoring tool in it. The “stop node” would trigger the monitoring tools that each one has, if there is any… like a side effect.
But yeah, I think this could not be a one-fits-all solution and calling other programs/ services that are suppose to be there isn’t the job of the storagenode.
What about Windows nodes? They do not have rsync by default, so it will require a different code for each platform.
Much simple is to create a shell script, then no code change is needed. However, you likely would not migrate a node every day or several times in a day, so it could be a once-run script. Doesn’t worth it, in my opinion.
But may be better, if we can collect some article here and add it to FAQ. If you can start such an article, I may make it a wiki and it could be updated by the Community anytime.
Further, deleting the storj files from the raid5 is a nightmare (whether using fle station or “rm -rf” in ssh). It took me a full day
to erase 1 satellite (one of the small ones!). I guess it will take me the same amount of time it took to do the first rsync to delete the whole node.
Deleting the old node files will indeed delete on a file basis, taking that same amount of days as a full rsync. But if you were running the node on a separate volume (which I’d recommend anyway) on that Synology, you can just remove the volume and it’s a matter of minutes.
Note: Removing a volume will stop all services for a minute though, including Docker.
Absolutely. Starting a node on a separate volume is one of the advices I forgot to mention for synology operators.
Anyway, it’s not as fast as you say it should. I had previously migrated a smaller node (1TB) that was on a separate volume. I erased the volume and it took like 1/2 hour. Obviously, having the larger node doing lots of I/O at the same time might have had something to do with it ![]()
On the other hand, if you say that deleting a volume stops docker (I didn’t notice that), the I/O should have stopped…
My node was about 6TB. Soon have to do the same to another 6,5TB node, I might have to check the time on that one.
Keep in mind, after removing the volume, a Synology will restart all services (including Docker). This causes some IO intensity already.
Starting the new node will trigger the file walker and boost the IO for a while after that, which could have been what you saw?
No. I was drowning in IO even before the deletion of the volume.
I have the file walker turned off. Anyway, the IO increases for a while whenever a node is restarted (not for a few days, as it used to happen, but for ~1 hour).
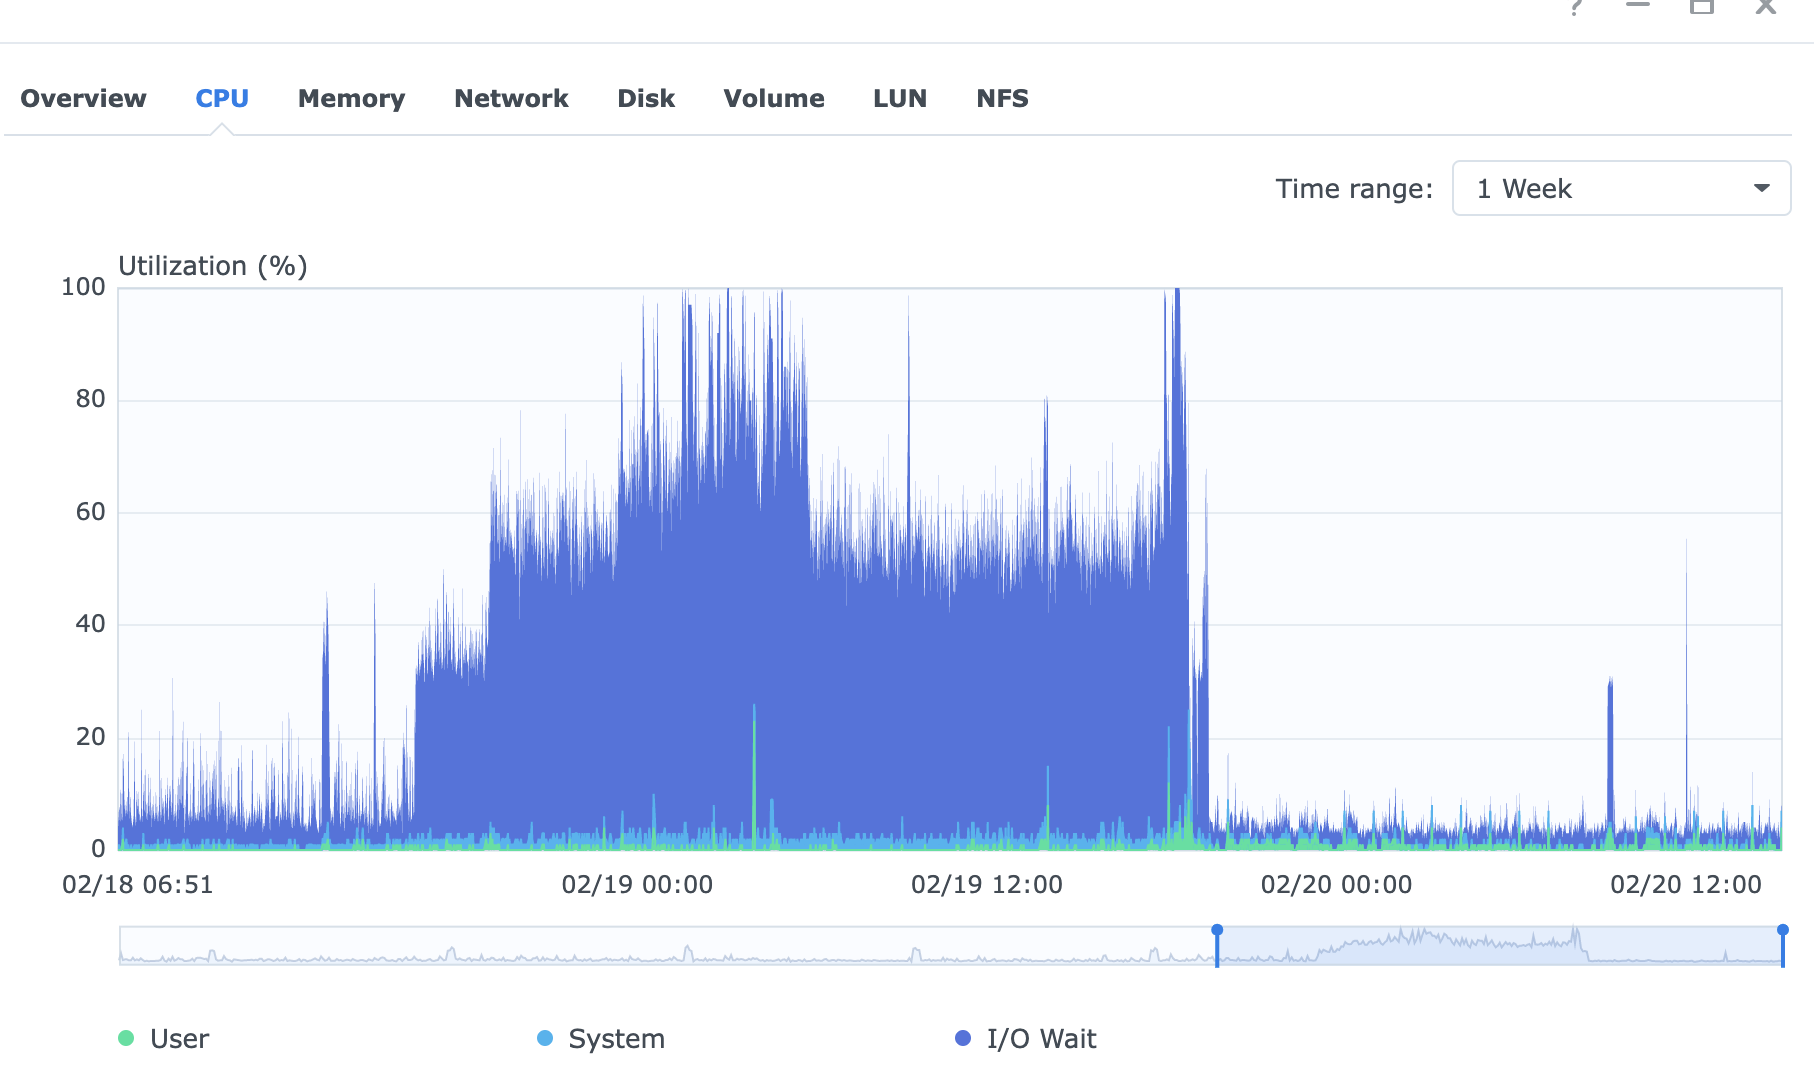
Regardless, I don’t really know what’s going on. This is the IO of another synology. 1 disk, 1 full node of 3.2TB in BTRFS. Never had an IO problem. Inserted another disk (EXT4) and started another node on the new disk.
That’s when the shit hits the fan on the pic. Stopped the new node, even worse. Restarted the old node, even worse.
Finally, stopped both nodes, restarted the synology DSM and the nodes, and now everything is ok…
How much memory have you installed? The storagenode is memory hungry.
In the NAS of the pic, 6GB (it’s a DS720).
But I stopped worrying about the memory usage of the storage node a long time ago. It might say 100MB and it might say 10GB (as docker app reports). It has nothing to do with the amount of installed memory or the current performance of the NAS. I could read 10GB storj usage at the same time DSM says just 1GB total usage (frightening, because it drives you to think storj is doing disk cache!) and close to zero IO wait. Also, I could read 100MB storj usage and get almost 100% CPU IO wait…
I’ve learned to disregard whatever docker says about memory usage. I have no idea what the numbers mean, I just know it’s not an indication of a well (or a badly) behaved NAS.
IO CPU wait yes, it directly translates into the actual behaviour of the NAS. When it reaches 60%, the NAS is a bit unresponsive and I loose too many storj races. When it goes over 80% I can’t do shit…
PS - I believe the storj memory reported by the docker app just keeps adding up until it’s refreshed. It’s not memory that it is using, it’s memory that has been used since whenever…
It’s never been a memory hungry unless you have a slow filesystem like NFS, CIFS/SMB, BTRFS or ZFS without tuning
CONTAINER ID   NAME           CPU %     MEM USAGE / LIMIT     MEM %     NET I/O           BLOCK I/O   PIDS
411600d7a25a   storagenode5   3.12%     91.74MiB / 24.81GiB   0.36%     48.6GB / 6.36GB   0B / 0B     37
dc6f70bbb9f5   storagenode2   4.50%     212.4MiB / 24.81GiB   0.84%     24.2GB / 40.1GB   0B / 0B     46
Windows:
PS c:\> get-process | Group-Object -Property ProcessName | Where-Object {$_.Name -like "storagenode*"} | Format-Table Name, @{n='Mem (MiB)';e={'{0:N0}' -f (($_.Group|Measure-Object WorkingSet -Sum).Sum / 1MB)};a='right'} -AutoSize

Name                Mem (MiB)
----                ---------
storagenode                52
storagenode-updater        19

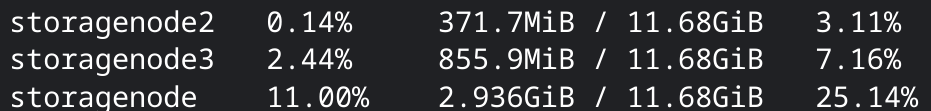
What’s docker stats says?
perhaps, it’s a VM. The host is idle

Now you can see a real memory usage, not what’s reported by the UI.
However the first one is using too much.
As I reported in “Tuning the Filewalker” and “Synology memory upgrade guide” the buffers and cache from running storagenode occupies the entire available memory. Now I have 18GB in machines with just one drive. All memory is used. Docker reports the cached/buffered memory also, I think, that’s why the big numbers. The difference in performance is there in running FW time and winned races.
Hm, I’m curios, why is it not used in my docker containers though…
1 Like
I started two and three without filewalker. the first node was started with the filewalker.
I’m on ZFS SCSI now, but also saw pretty much the same behavior with filewalker on a ext4 RAID10 and RAID 6 config on QNAP SCSI.
looks like any RAID seems works slower than a single disk then. My system doesn’t have any RAID.