New audit scoring is live

You can’t. It checks for matching node ID between identity and data. The node won’t start that way.

Understandable, but a lot of checks are already in place, like the one I mentioned above + readability/writeability checks. And I know dealing with IO timeouts was also in the works.

That said, this change wasn’t about that. However it does bring other big improvements we can all celebrate.

3 Likes

@thepaul are changes to the dashboard to incorporate the new scoring planned already?

Screenshots posted here: Your Storage Node on the us-central-1 satellite has been disqualified and can no longer host data on the network - #2 by faga
Shows red highlighting isn’t happening when a node is below 96% (not even yellow warning) and there is info text describing 60% as the threshold. I don’t see any changes on GitHub for this yet.

Perhaps given the relatively small allowed range (96-100), the yellow warning should probably appear below 99.5% or at least 99%.

Just checking that these adjustments are in scope.

3 Likes

Good call. @heunland noted this problem too. We’re getting it prioritized and assigned now.

4 Likes

created an issue about color coding for audit score on the dashboard:

3 Likes

I see a few more posts pop up now. Which was to be expected. But so far the story seems to be the same. File not found errors, pointing to actual data loss. It’s not exactly a flood of complaints, so that’s good. But I guess it does point out that the old system let nodes with fairly significant loss just hang around. Luckily there has always been plenty of redundancy to ensure that wasn’t really a problem.

I remember someone on the original topic saying they had a node with more than 4% loss too. I’m guessing they were caught by this too, but at least they were prepared this was coming.

Found the quote:

How is this one doing @CutieePie ?

I had to transplant a node from one HDD to a new one a few days ago, aparently enough data got lost during the copy to get disqualified, but It’s not a big deal.

Luckily it was a little secondary node, I need to learn how to move a node safely though.

There is documentation on that here. How do I migrate my node to a new device? | Storj Docs

Sorry to hear you lost the node though.

2 Likes

It’s cool, because it happened in the little one that has worked as a guineapig :rofl:

checked my nodes today, just for good measure since the new audit score is live.
everything was at 100% not even my node which have had a minor data loss good while ago now… but it was very minor… didn’t keep the audit score from jumping around for like ½ a year…

so no signs of any problems from what i can tell atleast, and the new audit score system does make me feel a lot more confident that my nodes won’t be unjustly DQ’ed.

have also been keeping an eye on the forum, so far a lot less complaints… ofc i’m sure those will keep trickling in for weeks or months… many might not keep much track of their nodes.

Yes or no? :innocent:

It’s possible those pieces have since been deleted. Or it’s just a miniscule fraction of data that is unlikely to be audited again.

Well… Both.

This effect is happening and over long periods of time you would see it reflected. But the score still has a little random noise inherent of any sampling method. Just much less. But there could still be a 1% + or -. This is why I said the score moving more than 1% is a good indication. If you had 2% data loss, you would literally have to double your nodes size before it becomes really noticeable. Which could take a very long time.

1 Like

Interesting :nerd_face:

So as expected the 10% data loss node was DQ’ed in around 24 Hours from the new audit System being enabled, as below (period of 30 days ish)

The dedicated Sat AUDIT workers failed to pickup the 10% loss, with the average audit working picking up 1% loss per day. As below the graph show’s AUDIT only downloads (yes the title is wrong :stuck_out_tongue: ) on average there are around 200-300 audits on ~ 1 million files, of which less than 1% on average fail.

The one SNO’s should be thinking about it the Sat REPAIR worker, as this is what caused the DQ. As interest, the 10% simulation node was over 12 months old, and so has more repair work activity. Another 10% simulation which is under 6 months old has still not been DQ’ed, this is due to the repair process not really kicking in yet, as the network seems to currently be able to achieve a 6 month+ durability on node pieces, and given current traffic patterns with most pieces with a sub 14 day lifespan (sad :frowning: )

While percentages are being handed out, it is important that it seems consequtive failiures on the repair worker are the issue. As below in the DQ period there were 15k REPAIR requests, of which 252 failed… As a percentage this was roughly 2% I think (Sorry math is bad so please correct) , however over 150 of those occurred within a 1 hour window.

zCapture

I will summarise;

1) Yes, the new DQ scale works much better in my view as it removes bad nodes quicker - I would still say it’s not aggressive enough, as there is a cost to repair but it good first step.

a) The display in the Node GUI is super confusing for SNO’s - 96% of AUDIT is now a DQ is not intuitive, remembering this forum doesn’t represent more than a few hundreds SNO’s. Maybe rename this stat to Percentage of Being DQ’ed or something, and make it 0% - 100%, so at 100% you are DQ’ed - I think this is what would save issues - It will also reduce the flood of query’s on the forum, it is just creating noise and lots of posts.

b) This change now impacts older nodes greater than 6+ months more, due to the REPAIR worker process getting older pieces from them.

c) This could create a negative wave of SNO’s in 6 Months… Imagine you join as an SNO and go through vetting, your node disk is bad but as the REPAIR worker doesn’t really pull your pieces as data so new… Then as you node approaches the 6 month mark, your older pieces start to be retrieved, and suddenly you go from fine now to DQ node.
2) I think this can be covered by pulling the AUDIT system out of the SAT code base - The AUDIT workers in my view should be dedicated workers. I would then split the worker base to address to start with 3 scenarios.
a) New Node Auditors - they are dedicated to more aggressive auditing to nodes under 3 months old - This way, if someone one new joins, they will be DQ’ed much quicker as there node is being audited more - This will make them feel better, as no one wants to find out there node is bad after 6 months+
b) Standard Auditor - This does nodes older than 3+ months
c) Old Age Auditor - This does pieces which are more than 6 months old

CP

Sorry, just realised i done a SGC sized post, sorry :rofl:

11 Likes

my node has been disqulified just in one us1 sattelite, other sattelites a ok. in logs i have seen just this type of error

2022-08-24T21:39:53.306+0500 ERROR piecestore download failed {Piece ID: MWKDV522B2RPYLAX7ZAI6ESWJMQZKDYROAADZWRSKPQFRC3C2QPA, Satellite ID: 12EayRS2V1kEsWESU9QMRseFhdxYxKicsiFmxrsLZHeLUtdps3S, Action: GET, error: write tcp 10.201…230:48298: use of closed network connection, errorVerbose: write tcp 10.201…198.230:48298: use of closed network connection\n\tstorj.io/drpc/drpcstream.(*Stream).rawWriteLocked:326\n\tstorj.io/drpc/drpcstream.(*Stream).MsgSend:404\n\tstorj.io/common/pb.(*drpcPiecestore_DownloadStream).Send:317\n\tstorj.io/storj/storagenode/piecestore.(*Endpoint).Download.func5.1:621\n\tstorj.io/common/rpc/rpctimeout.Run.func1:22}
2022-08-24T21:39:53.338+0500 INFO piecestore upload started {Piece ID: HCJAPKMALWJETUNZNOBDE5D3JFQE2TMN6MDZUVWN4WXKRGVMYXAQ, Satellite ID: 12EayRS2V1kEsWESU9QMRseFhdxYxKicsiFmxrsLZHeLUtdps3S, Action: PUT, Available Space: 1385922376448}

I love this graph as it shows the reset of the score and gradual degradation from there compared to the wild fluctuations before it. It’s nice to see it working in such a good visual representation.

I understand, but you should still see the score gradually dropping. It will happen at some point, it just takes a little longer on nodes with less repair. Could you maybe show the same graph for that node? I’d be interested to see it progress.

That’s something to keep an eye out for. If the repair worker clusters because of how it goes through pieces in a non-random way, it may DQ nodes a little faster than intended. In your case with about 1.7% failures. Just pinging @thepaul here to take a look at that. The audit process is built to be random, but it seems repair may cause some clustering that needs to be taken into account.

If you’re only failing 1% of audits, I would say your data loss at this point isn’t close to 10% anymore though.

I don’t think there is currently a need to be over aggressive on this. Even before when lots of worse nodes survived it didn’t really cause an issue. Keep in mind that this change came with a reset of scores, so we may see more nodes DQ’ed over the coming days. It’s best for the satellites to collect enough data about the node before DQ and take a little more time than risk DQ’ing nodes that weren’t intended to be DQ’ed.

I’ve advocated for this before and some nice bars on the dashboard. This is already how the numbers work in my earnings calculator. So yeah, I agree this would be better.

The impact will be the same, it will just take longer on smaller nodes. Which isn’t really a big deal as those also hold less data. There is also plenty of redundancy to cover for that.

Agreed, the network could do with a little more audits in general. Using repair is a partial and delayed solution that doesn’t work too well on new nodes.

I love these suggestions and I think that would help a lot. If this could be scaled up enough, perhaps using repair for this won’t be necessary at all. Given that repair is actually a non-random approach and leads to some clustering as you showed.

When they’re packed with useful information like this, I welcome that :rofl: (I can hardly say anything else about it as I’m prone to doing it myself, like right now, haha)

3 Likes

The error you posted isn’t one that impacts your audit score.
Have a look at this page to learn more and find out which errors caused the DQ.

1 Like

Even going by the graph before, this doesn’t look like a 10% loss anymore. It’s possible that the data that was once lost has for a large part been removed by customers and additional new data has made the loss percentage drop significantly. It almost looks like the score is already kind of settling where it is. I’m curious to see where this one is going over time. It may even survive.

Seconded! That is awesome. We don’t have historical tracking of any particular node’s reputation score, so that’s very interesting to see.

That does sound really good- it could be called “audit failure rate” maybe, even though it’s not exactly a rate. Or just “data loss”.

Interesting. Repair isn’t very random, as it traverses the segment ID keyspace in order, but the piece IDs that get repaired ought to be indistinguishable from random.

If there is a cluster of errors like that, it must be from something else wrong in the system. It could be network problems between the satellite and the node, for example, or temporary high load on the node that made it unable to service requests as fast as usual.

You’ll be happy to know this is already underway. Not removing from the satellite code base; the auditors will still be a part of the satellite, but they will be dedicated workers and will be runnable on dedicated VMs. But we will soon be able to scale up audit workers. (Currently, due to an early shortcut we took, we can only safely run one audit worker at a time.)

This might be harder to implement with the existing architecture. It helps us to be able to audit all the pieces for a given segment at the same time. That way, we don’t need to download entire pieces to check their hash. Instead, we can reconstruct a single stripe using Berlekamp-Welch forward-error correction and be able to identify which inputs don’t match the others. We could have different audit workers operate on segments which are new, 6 months old, etc, and that would naturally have a tendency to hit nodes of different ages as you suggest. Maybe that is an option to explore.

4 Likes

Hi Thanks for the response.

I’m currently running a workflow to deep look at the pieces involved in the DQ… it’s going take a long time as lots of systems to work through, and many rows however.

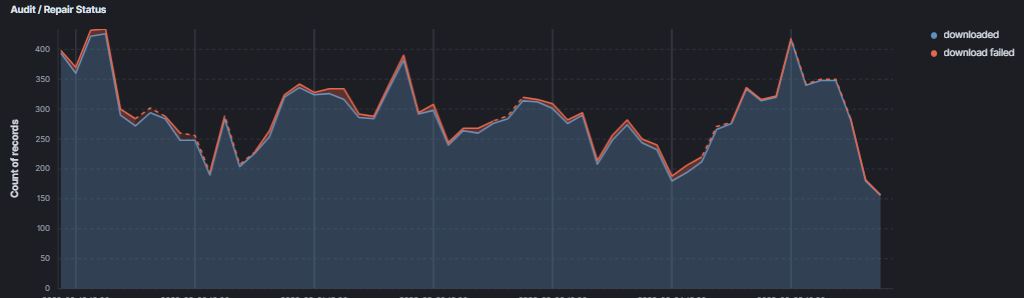
Top looking at early results, there is a trend which I wasn’t expecting on AUDIT.

As an example, one of the pieces involved in the 10% DQ traced is as below.

Aug 8th - GET_AUDIT - Piece ID AAA, node responded with “ERROR - file not found” - Time Delta hh:mm:30.421

This was a duplicate request processed, call trace below.

file does not exist
	storj.io/common/rpc/rpcstatus.Wrap:73
	storj.io/storj/storagenode/piecestore.(*Endpoint).Download:546
	storj.io/common/pb.DRPCPiecestoreDescription.Method.func2:228
	storj.io/drpc/drpcmux.(*Mux).HandleRPC:33
	storj.io/common/rpc/rpctracing.(*Handler).HandleRPC:58
	storj.io/drpc/drpcserver.(*Server).handleRPC:122

Then;

Aug 16th - GET_AUDIT - Piece ID AAA, node responded with “ERROR - file not found” - Time Delta hh:mm:05.341

Again, duplicate request processed for the same PIECE_ID (this really confuses me, my understanding was that a failed audit on the piece marks it off the node, and could trigger a repair)

Then;

Aug 24th - GET_REPAIR - Piece ID AAA , node responded with “ERROR - file not found” - Time Delta hh:mm:18.040

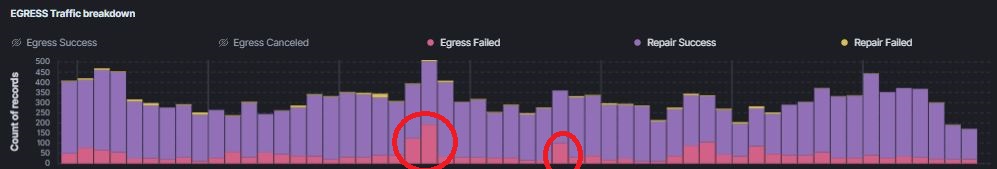
No duplicate on this one, again same Piece ID that has failed 2 audits, and this repair is part of the “Cluster of Non-Random pieces”

So,

  1. Why are we sending in some cases duplicate GET_AUDITS ? I’m really surprised the delta is exactly the same - again I haven’t got all the details, but the firewall segment offset stamped on the data is the same, which either means there was only 1 request received and the node has managed to duplicate this in the StorageNode code or two parallel get audit requests were sent over clearnet at EXACTLY the same time (this is hard, but not impossible - and can often be a side effect of leaking clusters, or bad network teaming, or even network card drivers)

  2. Why after a clear failed audit, where the file is not available do we retry again days later - it’s clearly going to fail again - my understanding was the file would be marked as lost on that node, and no further requests would be made, but this doesn’t seem to be the behaviour seen.

  3. The start of the looking was the GET_REPAIR, it was part of the 10% node burst of pieces and shares the same PIECE ID, as the previous failed Audits… why was the piece still being tagged to the node, with 2 failed audits days before…

…I’m still checking node and disk IO - it would be interesting if the duplicates are linked to busy disks causing timeouts.

#edit: nope, the latency from start download request, to node reply with failed download is < 200ms on average

#edit: also thinking, is this database issue with transaction locking and rollback when the duplicate requests happen - so the synchronised update to satellite causes no update to database, or rollback as locking or sync issue detects failed transaction and default is to rollback, ,therefore no update to piece - that would be bad as failed pieces would not be represented as lost. (again not bothered to look at schema, so this might not even be possible through constraints)

CP

This isn’t the case. The point of audits has never been to judge whether pieces were available, but it’s only meant to judge whether the node as a whole is reliable enough to keep around.

Even when you include repair, audits only touch a very small subset of your node. So it’s not possible to reliably mark pieces as lost anyway. And as long as the node has lost an acceptable amount, the redundancy on the network can easily handle those losses.

Is that in order of segment id or in the order they are listed in the table? The first should be quite random I think, assuming segment id’s are randomly generated like piece id’s. But if it’s in order of how it’s been added to a table, there would be time wise clustering, which could be problematic for nodes that lost data because of a temporary problem, like a mistake during migration or something. If you lost a few hours of ingress and repair goes through them in chronological order, it would cluster those errors together and fail a node faster than intended as a result.

node size is also a major factor when it comes to new nodes, as a node finishes vetting its size starts to grow at an immense rate, and thus 10% dataloss a week ago for a node might only represent 1 %…
i know this is only a short period this is relevant, but still early on the ingress of a month can be a substantial part of a nodes total data stored.

so unless if one is getting rid of or corrupting 10% of the data on a continual basis, a new node could have moved back to a state when it won’t be DQ.

agreed the score should be uniform or easy to read…
personally i might just make it the same as the suspension score and online score.
since they are already known numbers…

not sure why they even change it to 96% anyways… i mean it was not like DQ would happen at 40% data loss before…
it should be changed back or revamped.

complex topics or ideas aren’t easy to do in short form. :smiley: