"Online" indicators suddenly dropped

a working connection can still be unstable, somethings might barely notice it, while others can be very sensitive to it… live stuff like video calls or VoIP are those people usually notice minute issues with their connections… so if you do extended calls like that without any issues, then it’s most likely stable…

atleast your node seems in good health and the successrates seems good

Hi again

I come with some more information… but even more confused than before :slight_smile:
After one day left it to work, dashboard shows “offline” status.
But the logs show that I have healthy traffic anytime I look. Is it offline but exchanging packets like: ?

2020-12-08T16:56:28.933Z	INFO	piecestore	downloaded	{"Piece ID": "A727EZTULHDASQPJ35B4Q4VZY7AYNNRTWENUTXWRCHK37P6IAEYQ", "Satellite ID": "1wFTAgs9DP5RSnCqKV1eLf6N9wtk4EAtmN5DpSxcs8EjT69tGE", "Action": "GET"}

At the same time I find some errors if I try command:

sudo docker logs storagenode 2>&1 | grep "error"

Like, for instance, this one:

2020-12-06T01:25:38.884Z	ERROR	piecestore	upload failed	{"Piece ID": "UBBHFYXPBTP7EGLFALVBGYHXGNF7P33RRXDIDQNHYI6CKWAXRSXA", "Satellite ID": "12rfG3sh9NCWiX3ivPjq2HtdLmbqCrvHVEzJubnzFzosMuawymB", "Action": "PUT_REPAIR", "error": "tls: use of closed connection", "errorVerbose": "tls: use of closed connection\n\tstorj.io/drpc/drpcstream.(*Stream).RawFlush:287\n\tstorj.io/drpc/drpcstream.(*Stream).MsgSend:325\n\tstorj.io/common/pb.(*drpcPiecestoreUploadStream).SendAndClose:1064\n\tstorj.io/storj/storagenode/piecestore.(*Endpoint).Upload.func6:407\n\tstorj.io/common/rpc/rpctimeout.Run.func1:22"}

or

2020-12-06T11:19:27.988Z	ERROR	piecestore	download failed	{"Piece ID": "DKXXYPTSOKOKZBU66PVT4YIPVEGGKAGELTKHXDIAXKMTU7MTU6EQ", "Satellite ID": "12L9ZFwhzVpuEKMUNUqkaTLGzwY9G24tbiigLiXpmZWKwmcNDDs", "Action": "GET", "error": "write tcp ((some-ip)):28967->((some-other-ip)):37192: use of closed network connection", "errorVerbose": "write tcp ((some-ip)):28967->((some-other-ip)):37192: use of closed network connection\n\tstorj.io/drpc/drpcstream.(*Stream).pollWrite:228\n\tstorj.io/drpc/drpcwire.SplitN:29\n\tstorj.io/drpc/drpcstream.(*Stream).RawWrite:276\n\tstorj.io/drpc/drpcstream.(*Stream).MsgSend:322\n\tstorj.io/common/pb.(*drpcPiecestoreDownloadStream).Send:1089\n\tstorj.io/storj/storagenode/piecestore.(*Endpoint).Download.func5.1:580\n\tstorj.io/common/rpc/rpctimeout.Run.func1:22"}

In general, during this year, node seems to be offline, then I restart, but indicators are always near 100%… really it doen’t make any sense to me.

EDIT: 10min after what I told you, dashboard shows “online” ¿?

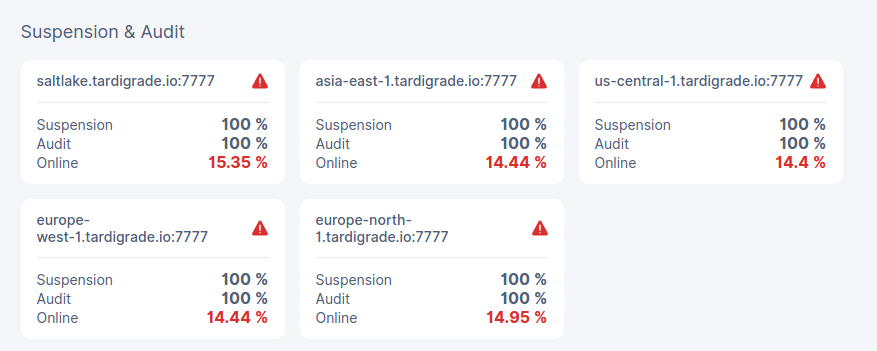
EDIT2: Now I see some suspension notification…

You have 11pages that isn’t a good sign. It means you have a few issues going on with your node.

From page 5 and below it is blank.
And the notifications seem to start from “yesterday” until 1 hour ago.
So problems seem to start after I started this thread… no idea what is going on…

And how is it possible that I am suspended, but online, but with 100%/100%?

I think you can be online if your node responds to it but suspension isnt tied to being online its being able to get the files or not. Either something is blocking it or your network or internet can’t handle it.

Ok, thanks.
And can I have that reputation while being suspended?

Well when your suspended you stop receiving files.

Please, search for “GET_AUDIT” and “failed” in the log:

Executing:

sudo docker logs storagenode 2>&1 | grep GET_AUDIT | grep failed

Produces an empty result

i bet you that your storagenode updated and now the logs are gone…

did you export it like i told you?
try to run it on the full log file that should be in the /tmp dir

which is exactly why i asked you to export it :smiley:

and if it hasn’t updated to 1.18. yet then i would recommend you export the logs
this should be the command for it…

think this should work… ain’t at a linux system right now… so can’t check it… else just delete the "$date… part and save it to a regular filename rather than a date

like /tmp/storagenode.log
docker logs storagenode >& /tmp"$(date -d “$date “%Y-%m-%d”)”-storagenode.log

So, automatic upgrade is erasing logs?! Obviously I am not on my computer exporting logs for the case it happens.

It seems that yesterday it updated to 1.18.1, and logs are from then.

I had some exports from previous 5 days,

I get many episodes for “GET_AUDIT” like for instance:

`2020-12-05T23:56:17.330Z	INFO	piecestore	downloaded	{"Piece ID": "GA5CJZZJNGP7FFV2EADXSGCCRXFF6YSTAWO4EXH5UW3P4XXNBPXA", "Satellite ID": "121RTSDpyNZVcEU84Ticf2L1ntiuUimbWgfATz21tuvgk3vzoA6", "Action": "GET_AUDIT"}`

But only one for “failed”:

2020-12-05T21:45:05.643Z ERROR piecestore upload failed {"Piece ID": "5OMBQYUINLNVHZSZAW7QWDNRROGKXAWWIHEEEC3FEFSAJ6H4UEGQ", "Satellite ID": "12rfG3sh9NCWiX3ivPjq2HtdLmbqCrvHVEzJubnzFzosMuawymB", "Action": "PUT_REPAIR", "error": "tls: use of closed connection", "errorVerbose": "tls: use of closed connection\n\tstorj.io/drpc/drpcstream.(*Stream).sendPacket:241\n\tstorj.io/drpc/drpcstream.(*Stream).CloseSend:409\n\tstorj.io/common/pb.(*drpcPiecestoreUploadStream).SendAndClose:1067\n\tstorj.io/storj/storagenode/piecestore.(*Endpoint).Upload.func6:407\n\tstorj.io/common/rpc/rpctimeout.Run.func1:22"}

What are your online scores looking like now @jaumemiralles? I am investigating this issue to see if there could be a bug on the satellite-side of tracking online_score. If you email your node ID to me at moby@storj.io, that would help.

2 Likes

Sure, thanks, I will email in short.

My scores:

2 Likes

i think there might be a related issue, or maybe it’s the same issue… i duno…

if there is a 1 month cool down on online score recovery, and big nodes 10-20TB will be audited every 1 minutes to 10 seconds or so, then it’s possible that it would be impossible to recover online scores because even a version / watchtower update would break an uptime window / affect online score and thus reset the cool down.

not sure if that is a real problem, but i think it’s very possible that it is…

As I said in the thread with your similar guessing - it’s not.
The audit is performed several times in the check window, but not every 10 seconds.
I would not try to calculate a probability, but it’s too small.

2 Likes

pretty sure i would have remembered that… but sure maybe i misunderstood what you said…
nice to know, because it was your explanation that made me think that in the first place.

hold on a second… i’ve had 30 sec downtime which made my online score drop…
when i was testing it initially… purposely… and it was the first down time i had for i duno months aside from storagenode software updates… and my online score had been 100% stable since it was introduced…

so how can it check multiple times if i only have 30sec of downtime and that made it drop…
yes i have not verified that result… because thats kinda tricky when it takes over a month to recover.

from what you are saying doesn’t seem to support practical tests, in my experience… ofc i cannot say that wasn’t just random chance… but i don’t think so

P.S
ofc if the uptime window’s are like days long or a week then maybe i reset my router or something brief like that, but i assume these windows are less than a day or so.

maybe we should have a diagram for explaining approximately / exactly how this online score thing works…
instread of it being explained in theory.

The implementation matches the design doc here: https://github.com/storj/storj/blob/c2a97aeb143791dd7edd8bea5bb43558a95b57de/docs/blueprints/storage-node-downtime-tracking-with-audits.md
So there is no difference in “theory” vs. “practice” in this case.

In production, we have 12 hour windows and a 30 day tracking period - that is 60 windows per tracking period, two windows a day. Every single audit you get will affect your online score to some extent. For example, if you got audited during your 30 seconds of downtime, that offline audit will have a negative affect on your online_score. But other audits inside the same 12 hour window will be equally weighted.

So in one 12-hour window, if you get 1 offline audit and 10 total audits, your online_score for that window will be 0.9. Then, your score for that window will be averaged with all the other windows in the 30 day tracking period to calculate your overall online_score. So if you had perfect uptime outside of that 12 hour window, your online score would be (59*(1)+1*(0.9))/60 = 0.99833…

I can explain in more detail, or even point you to specific parts of the code which do the calculation. Please let me know if this explanation helped.

6 Likes

no that’s actually pretty good… i suppose that also sort of explains why it can take like 24-40 hours before it hits the online score.

i think that should be added to the documentation if there is a page about online score… the concept is still pretty new to most SNO’s and it can be a bit confusing to learn…

when it’s difficult to find a brief simple explanation in an obvious location where people can find it.
i’m sure it would be very appreciated if it was placed somewhere like here.

or maybe a little info or mouse over tag that just describes in not so many words but a accurate easy way to understand.

like say… online score is equal to node uptime % over the last 30 days
i think something like that would save a lot of answering questions…

going to make that into a feature request tomorrow :smiley:

1 Like

We are planning on making detailed info about audit results available via the API, which should give nodes all the information necessary to understand how their online score was calculated. But additional information upon hovering over online score wouldn’t hurt either.

2 Likes