There is no way to pass a dataset to a VM, at least I do not know of one. I can pass a zvol as a disk to a VM, but, of course, I need to format it.
I believe you may use iSCSI (or do not use VM and use docker/LXC instead, can I dream?)
Sounds like the problem that I mentioned above: filewalker processes piling up on top of each other, adding up to the load.
If the load is too high because the system is waiting on read processes to finish, the node can’t write normal customer traffic as fast as it receives it. This balloons the memory usage (the node tries to buffer requests), up to the point that it starts eating into the system’s cache. The system becomes even slower, because now all reads have to go to the already overloaded storage directly since the cache is empty. More buffers fill up, less cache available. When cache gets exhausted, all the buffers in the system get full (node’s own + system buffers). No more read/write requests can be performed by the system. FYI: I’ve seen loads of 1500 on a system once (compare it to the 40 shown above). I still managed to save that system just in time.
I can’t explain it any simpler: storj nodes need as fast access to the storage as possible. Currently the most cost effective way to do that is to move databases to an SSD (which can be the same as the OS drive), format the storage disks to a proper filesystem (that rules out any filesystem used by windows), that doesn’t do any checksumming (rules out btrfs,zfs). Anything else is masking the underlying problems. I can tell you that a 1TB node does not behave the same as a 20TB node. Maybe it works today, but I can guarantee it will not continue working when it fills up.
I was thinking about the same, thank you for the explanation.
So, if I would like to move the DBs from the HDD to the OS SSD, I need to stop the node, copy the db files to any directory on the SSD and modify the config.yaml file for the given node.
I have the node installed in this directory (4th node on the PC):
c:\Program Files\Storj3\Storage Node
I have the exe and config.yaml files here and the identity files in a subdirectory.
I would create a Database directory and move all the .db files into this directory.
Currently I have this in the config.yaml:
path to databases
Storage2.Database-Dir: s:\
This should be modified like this, in case if I create a directory (named Database) in the node’s folder:
Storage2.Database-Dir: c:\Program Files\Storj3\Storage Node\Database\
Would it be ok like this? Is there anything else I need to change?
If yes, I would repeat the same for all the other nodes as well.
Yes, the top level guide is:
- create a directory for databases somewhere (C:\Program Files\Storj3\Storage Node\Database)
- stop node
- copy all .db files from storagenode/storage/ to the directory you created in 1 (don’t move, just in case something goes wrong)
- edit config.yaml to set the new storage2.database-dir (keep the quotes, ie storage2.database-dir: “C:\Program Files\Storj3\Storage Node\Database”)
- start node and check the logs
Sounds like a design oversight/inefficiency. The customer traffic is less than 10mbps, so, it is logical that the storage should not need to be very fast. However, the housekeeping processes are the ones that for some reason need very fast storage. It would be great if the actual customer traffic was 600mbps, requiring 75MB/s, but it isn’t.
My solution seems to work though:

So, hopefully this is not a problem anymore
You are comparing apples to oranges. The traffic may be “low” under normal circumstances. I’m not talking about normal usage. I’m talking about when the system is overloaded. One of my nodes just cruising along without any filewalkers shows 91 iops. Taking into consideration that typical SATA 7200rpm drives have ~80 4k random iops you can see that the node already writes as fast as it can given the traffic pattern. You aren’t streaming data sequentially to the drive, you are writing parts of a file while also trying to read data back from the drive, both of them being at the exact opposite ends of the platter.
It may be my enterprise background, but speeds aren’t everything. IOPS are. Writing simultaneously just 1000x512 byte sectors while trying to read back 1000x512 byte sectors that none are next to each other (in other words the drive’s own read ahead optimization is completely useless), would make the drive struggle. I’m requesting 2000 iops from a drive that can only do 80.
Yes I understand that your node has much more available bandwidth. It can’t use the bandwidth available not because the software is “faulty” but because transferring data from point A (the client) to point B (your node) isn’t as simple as “take these sectors and copy them on that drive”. The sender needs to go through encryption, erase coding, relying on its own upload (ie my 768Kbps ADSL line) to send that data to your node. Your node has to perform some needed accounting (ie it can’t just dump the data to the drive in any sectors are closer to the head at this given time), all while trying to serve me the other files I have previously uploaded, to my own TV-streaming-PC plugged in my other 1Gbps fiber.
Currently there aren’t enough clients to saturate 23,000 nodes. Maybe (hopefully) one day there will be. FYI I’m seeing ~20Mbps on my nodes.
It depends on the usage pattern, but yes, Storj node has mostly random access. However, it is not completely random 4K access, because a lot of pieces are bigger than 4K and, as far as I know, the customers usually download the entire piece. Writes are also random, but not as much, since zfs batches up the transactions in the SLOG and then writes them to the drives every so often (by default 5 seconds, I have set it to 30 seconds).
Yes, it is not that simple, but also not that complicated.
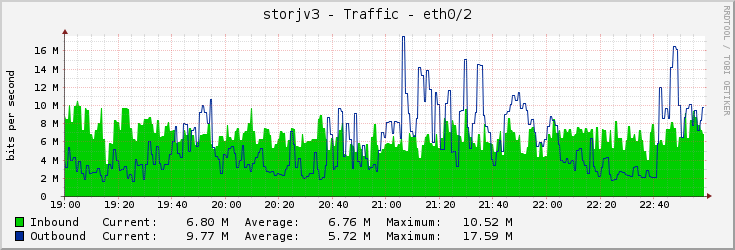
Customers request data, currently, at maximum 18mbps and upload new data at maximum 10mbps, though averages are lower.
That means every second my node gets up to 1.2MB of new data it needs to write and also it need to read up to 2.2MB of data from some random locations. If that 2.2MB of data is comprised solely of 4KB sized pieces or smaller (none of which are cached) then my array would have problems. However, it could also be just two 1.1MB pieces, which my array would be able to read easily. In reality it would be somewhere in between.
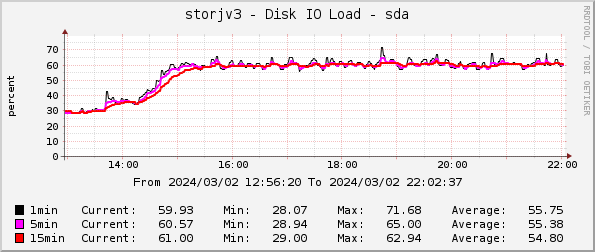
There is another thing - the IO load on the VM is pretty low when it’s just the customer requests
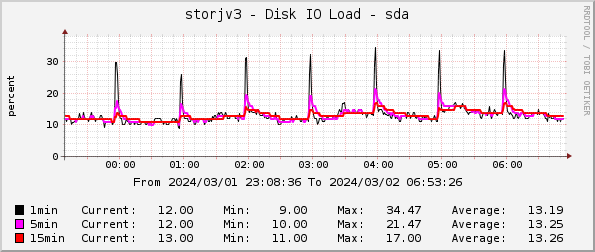
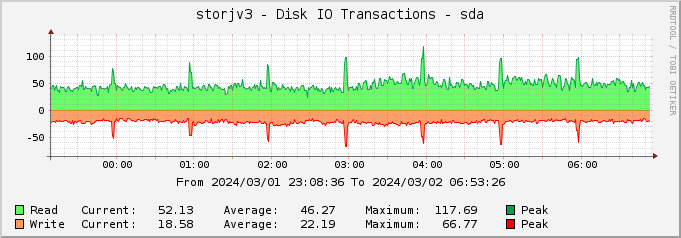
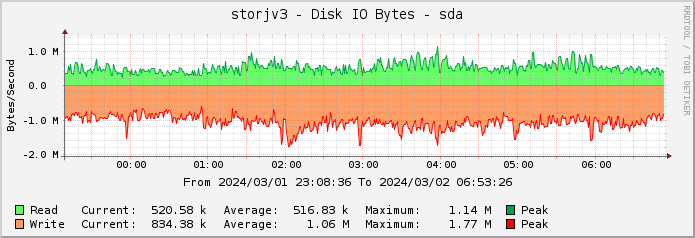
The spikes every hour are likely some other housekeeping process, probably deletes, but when it’s not running the IO load is just about 10%. Also, my node wins over 98-99% of the races. So, it seems like there is enough performance for the customer requests and in the past there were higher loads (when Storj was doing some testing) where my node worked great.
So, in my opinion, the problem is not that there are too many customer requests that my node cannot keep up, but that the internal process takes up (and requires) so much IO that it slows everything else down. A process that is likely possible to completely disable in the node configuration, but there is not built-in way to just slow it down. Well, at least I managed to slow it down.
Thank you for your help!
I changed all four nodes, let’s see if the issue will come back in the coming weeks.
Btw, if I use the quotes the node do not start, without the quotes, it works fine.
I’m sorry if I somehow diverted the topic, but on the other hand, I believe my issue/situation somehow gave a good example to the OP.
Haven’t used windows since 1997, didn’t know quotes were not needed ![]()
Many of these reads will be metadata reads, as your guest VM does not have enough RAM to cache them. So lots of small reads from guest standpoint, which will be pretty much invisible on the bandwidth graph. Your ARC is pretty big though, so likely cached on the host.
I assume your graphs with storjv3 show measurements from the guest, and with starlight from the host?
It should make sense that if the guest is accessing mostly cached data, it’s the CPU that will be the bottleneck. What type of virtual bus/controller are you using?
I suspect if you reduced ARC a bit and increased your VM memory by the same amount, file walkers might go faster due to less host-to-guest copying.
Expired pieces are checked every hour.
Correct
Virtio-SCSI as it has TRIM/discard so that when data is deleted from the node, it is also deleted from the host.
I used to have 32GB assigned to the VM, then thought that having a larger ARC may be better, as zfs is really efficient with its cacheand it can be used for other VMs if needed.
Maybe I should go back to 32GB, now that I have added more RAM to the host.
IIRC it is also the fastest one, so a good choice here.
BTW, I made a small experiment in the meantime. I measured how much is ext4 actually writing to disk if I tell it to create 1M files 1 KiB each, with an fsync after each file and a file move to one of 1k directories. This roughly reproduces the I/O needed by storage nodes to write 1M pieces of the smallest possible size. Turns out a default ext4 performs close to 50 GB writes, and one tuned with my usual settings—half that.
Makes sense given that for each file, the file system needs to create two direntries and remove one (optimistically 3 pages modified), write an inode (1 page), mark inode as used in the inode bitmap (1 page), mark data sectors as used in the sector bitmap (1 page), write the file itself (1 page), and write relevant journal entries (at least 2 writes). Each page is 4 KiB, so a total of 36 KiB per file in the optimistic case for the defaults. Some of these writes are coalesced in my usual settings.
This kind of traffic is sort of the worst possible case, but…
…doesn’t seem that weird to me with any more complex storage setup. Kinda shows that using a separate file for each piece is suboptimal.
So, with 1KB file size, ext4 writes 50 times more data. Writes are not that big a problem because of SLOG, however, it would probably read a similar amount of data to read those files (assuming the metadata was not cached).
If it was only 1KB files, yes, but normally it is not. As I said, if the filewalker processes are not running, the IO load on my system is 10% or so, which means that it is perfectly capable of dealing with the actual customer uploads and downloads. Only when those processes (which are not directly related to the customer traffic) start there is a problem.
I may have noticed another problem, related to TRIM. I had mounted the filesystem with the discard option and it seems like Storj likes to delete a lot of files all at once (instead of one by one as customers delete them), that may cause a large IO load due to discard operations. I have remounted the filesystem without that option and will try to run fstrim manually (later add it to crom) to see if this works better.
This option (delete files as customers deletes them) is currently not used, see
So, all deletions are now only via filewalkers