You do have some very long running uploads. Do you still have the request limit in place? If so those could lead to lots of rejects.
Nope i killed it. Just checked. What could cause that? Is it drive again?
Well it could literally be customers who are uploading super slowly. So it’s not necessarily a problem.
If you look at
curl localhost:5999/mon/funcs
you could search for the upload function and get stats on normal run times. Most likely these are just outliers. And it’s not like you have hundreds of em stacking up.
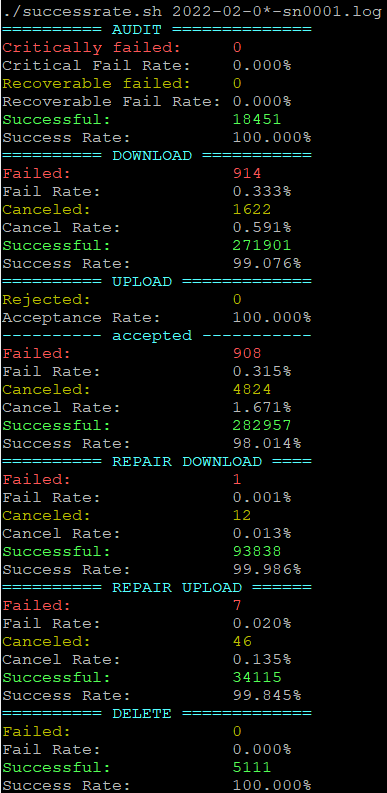
My success rates are 97.879 down and 99.766 up. Seems like if i had issues with either they wouldnt be that good.
Well if they are stuck forever they will never show up as successful, failed or canceled in the logs, so the successrate script wouldn’t actually count them. So that’s not a guarantee. Maybe you should wait until you have high ram use and the CPU starts climbing again. I doubt we’ll find much special until that happens.
True. Ill be giving a higher limit like 3 cores a try and see if that climbs, and again with no limit just to see. Thatll be a bit tho.
1 Like
Ive had the limit off for 24 hours and no increase. Im so confused.
It’s like the quantum observation effect, you started looking under the hood so it instantly collapsed into a well working node, haha.
4 Likes
Before the quantum theory become popular (20 years ago) we called this effect “effect of presense” or “engineer’s effect”, when all become working as intended even close to ideal parameters as soon as you call the service engineer to take a look.
Of course all become broken again as soon as engineer went out.
At one of my previous jobs as the technical director of an enterprise, I was such an engineer . My subordinates even put my photo in the server room and said with a serious look that it works.
11 Likes
Haha, love those sentient servers who always behave when the supervisor is around. (And, yes, “who” is the correct word when sentience is in play)
And since theyre sentient, some amount of fear might come into play. After all Im killing the containers and starting new ones. If you behave you live longer.
2 Likes
Lol I 100% believe this is true ![]()
1 Like
so for a bit of a follow up to this…
i was testing how low i could set the memory allowed on my storagenodes.
had this running at 512MB, proxmox also never recovered after this, whatever happened with it, shutdown the entire server to get stuff back to normal again.
so yeah maybe the cpu usage was due to the node running out of memory.

Sorry @SGC , but how is it related to increasing of CPU usage stated in the topic?
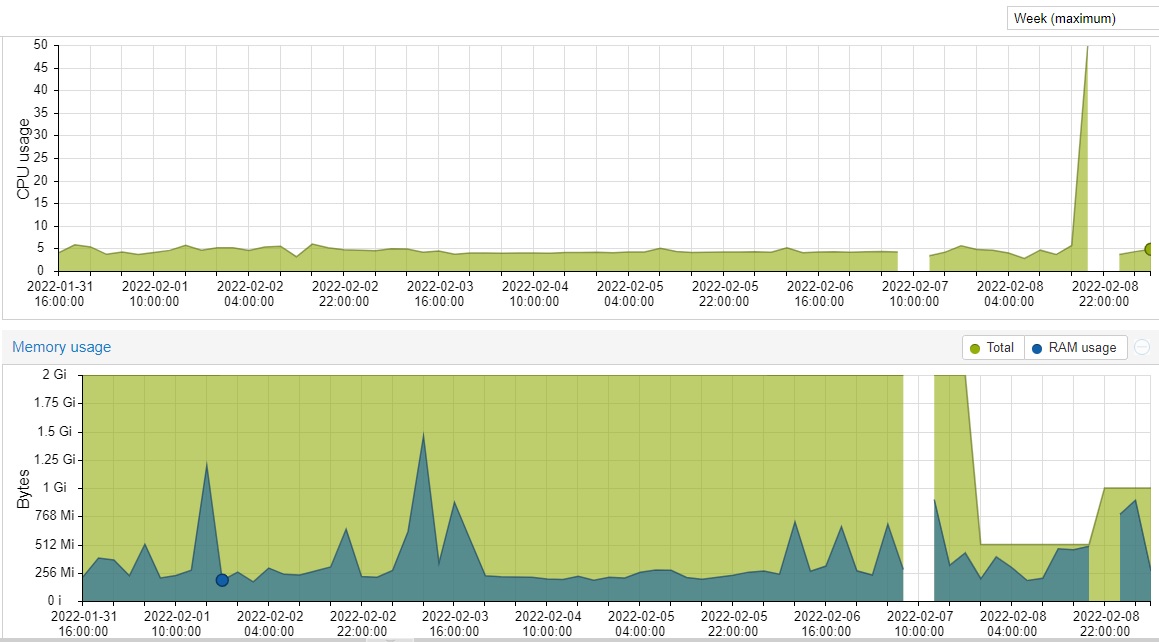
sorry thought it was pretty clear that 50% cpu usage wasn’t normal for a single node
cpu max usage for the last week for a similar node, which didn’t have memory issues
i know it got close when i limited it to 512MB but it didn’t touch the limit…
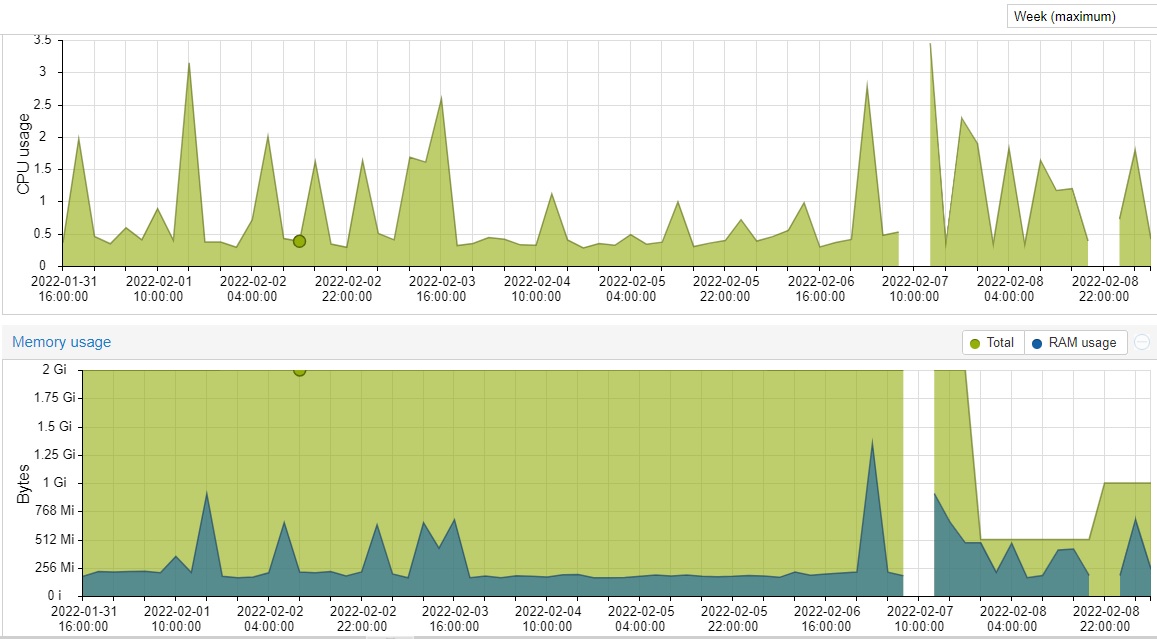
excuse the holes in the graphs been dealing with other stuff and had this memory reduction test thing going… the data isn’t that pretty… but maybe ill take the risk and recreate it so it looks clean… but that will take a while and i think the results are pretty clear.
this post was actually partly why i decided to do the test.
i think the correlation between OOM and increasing CPU usage is pretty clear in these two graphs.
sorry if i didn’t explain it well enough initially.
the light green in ram is the container max allowed ram, it changes because i changed it… and the reason it goes up just as the 512mb reaches the max, is because i noticed the server was behaving weirdly and i found out it was that node that seemed to be causing it and i increased the ram amount to see if that would restore the server…
but ended up having to pull the power.
you sure that isn’t a week avg graph while mine is a week max, the memory spikes are usually garbage collection, or if i have restarted the nodes. i think
restarting nodes usually up’s the memory usage quite a bit, but that is avg out on the proxmox graph when its isn’t set to max.
in regard to the cpu usage, i find the storagenodes use less overall cpu when i allow them to run in parallel across multiple cores, i think that might be due to less core latency due to the storagenode not having to wait for a core to be ready, but just throws it at one that is free.
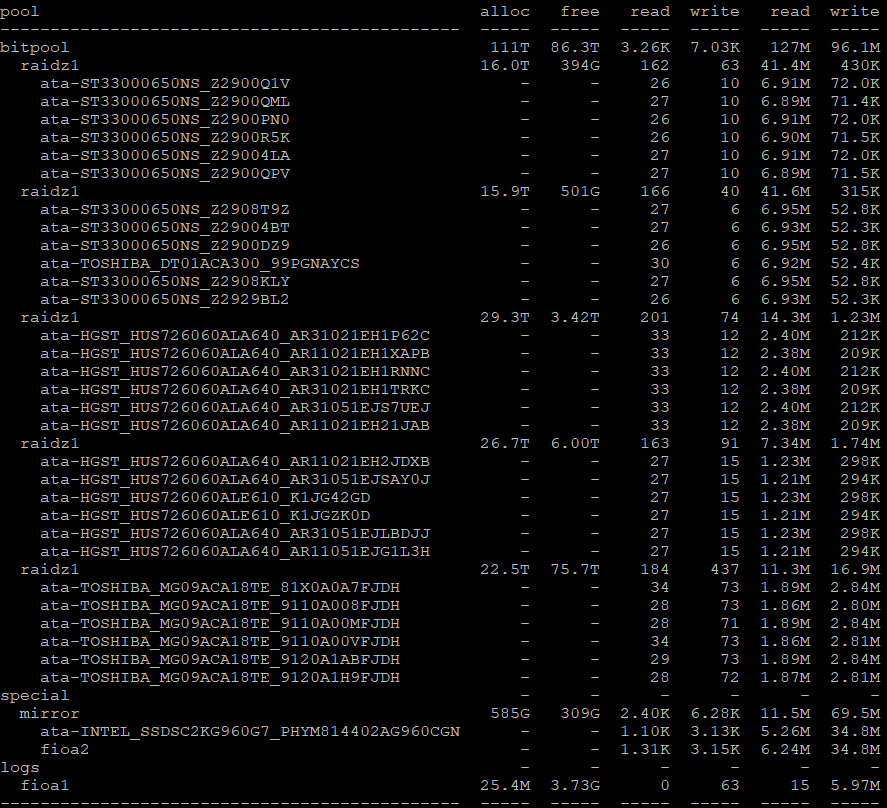
i doubt my storage is slowing down the nodes…
but yeah there are always new and interesting issues to deal with lol
have been fine tuning my storage solution a lot, it’s running better than it has in a long time.
ofc its not perfect, still trying to get to 99.9% 
which i know it can get to if i turn off enough of other stuff.
a day for my 16TB node, yeah uptime is a difficult one lol, they should really add a bit of slack so we can get our 100% when its going good… i rarely reach the 99%+ uptime.
for various reasons, usually me testing stuff and ending up driving the server into the ground lol.
and it takes so long to boot.
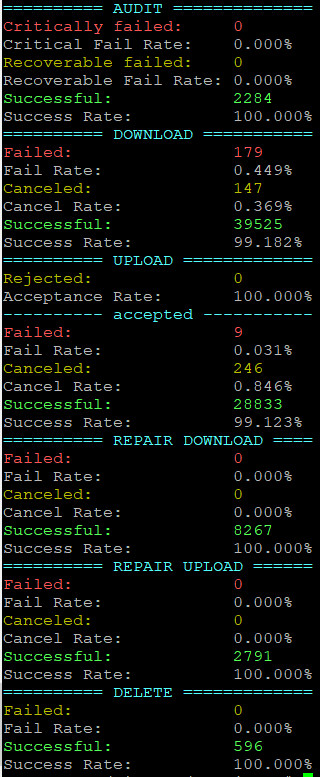
yeah downloads seems to be the first to drop due to latency i think.
successrates for this month.
1 Like