Storage node CPU usage unusualy high

Update: Got’em!

The Windows instances are dedicated to Storj’s node.
Not used by anyone for anything, it’s just an environment for storagenode operation, but Thank You @Dunc4n1d4h0 for input. I tried my best to castrate my Win10’s, and turn off any useless settings. I guess on some instances, its instinct to tirelessly update 24/7 prevailed!

And there i decided to f’kn push that problem off the cliff, and spent some hours today
determinated to find out what’s up, so i watched, and made an observation…

that Win10 PRO version like 1903 or 1909 does not matters,
nor the OS build number,
what matters is what Windows Defender or Microsoft Windows Security is allowed to do,
or break free to do …

i check every node and instance,

for example:
2_5 instance, CPU spike problem occures
w10 PRO 1903
OS build 18362.836
Storagenode 1.95.1
Uptime 42h
(sats online: 100%/100%/99.9%/99.9%)

But few other instances also with same stats, and NOT a single CPU spike problem.

All nodes got min. 99.xx% Online time,
but i saw Uptime someimes 15h, sometimes 42h, only two got like 140h.

So i looked at windows “Event Viewer”.

Not good.
i found that storagenode service restarts sometimes few times a day!

“The Storj V# Storage Node service
terminated unexpectedly. (…) Restart the service”
17.01.2024 02:31 AM
17.01.2024 11:04 PM
19.01.2024 07:43 PM
21.01.2024 03:57 PM
Examples of restarts.

i mean, not a new problem,
2 years ago or so, after arguing in the forum, back and forth about how i noticed this problem started to occur, when no fix, i got tired,
and i set this service just to restart if it crashes
i got 99.9% online stats, but filewalker has hard time to finish its works i see…

So i started to watch.
Aha!
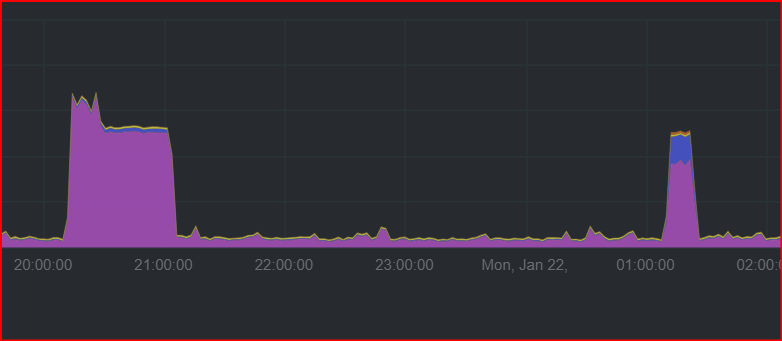
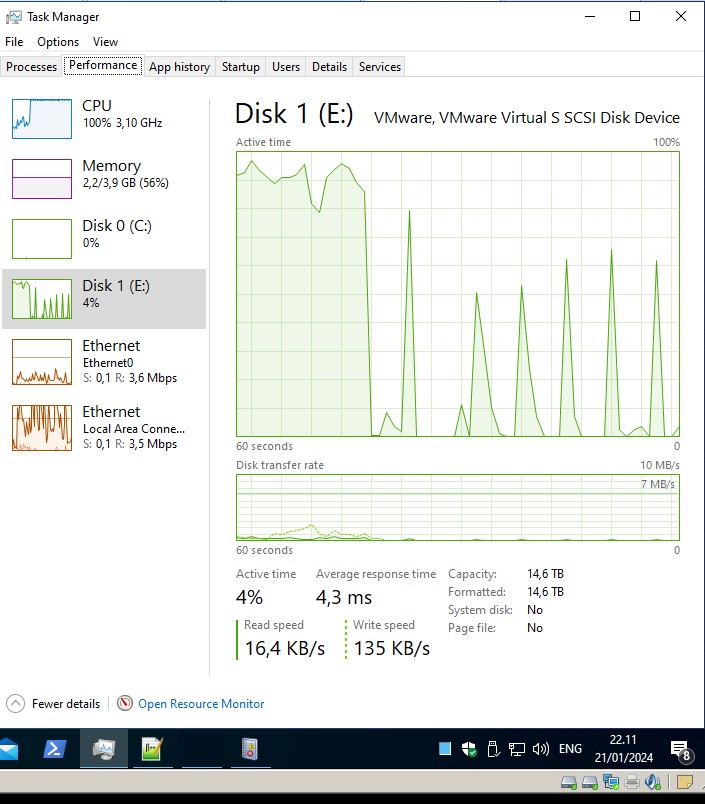
a Windows instance’s CPU goes to 100%, caused by storagenode spike to 70-80%
Couldn’t really find anything correlating in event viewer other than Windows Defender Update just 1 minute before, but that not always happens, and node just restarts too often!

im setting log level to DEBUG now to see more.
i noticed that common settings in nodes where CPU usage spike occures are “debug.addr:127.0.0.1:5998” in configs
so i hashed it for now

hmm seems not helped coz again restart unexpected after 100% CPU usage:
in logs it looks like normal work untill sudden:

2024-01-21T19:34:21+02:00	INFO	piecestore	download started	{"Piece ID": "AT2YZINPJNJ4M3YDJIKVKJALCY6KUVJIGSOGPV3FETS7HSVL2ENA", "Satellite ID": "12EayRS2V1kEsWESU9QMRseFhdxYxKicsiFmxrsLZHeLUtdps3S", "Action": "GET", "Offset": 0, "Size": 9472, "Remote Address": "79.127.201.209:36848"}
2024-01-21T19:34:21+02:00	INFO	piecestore	download started	{"Piece ID": "RTZ47ISKO5TT6ZGITDQJENGX6EVKMJOVMHTBN4QHERHFE6QFY46Q", "Satellite ID": "12L9ZFwhzVpuEKMUNUqkaTLGzwY9G24tbiigLiXpmZWKwmcNDDs", "Action": "GET", "Offset": 0, "Size": 92416, "Remote Address": "79.127.219.33:52670"}
2024-01-21T19:34:22+02:00	INFO	piecestore	downloaded	{"Piece ID": "RTZ47ISKO5TT6ZGITDQJENGX6EVKMJOVMHTBN4QHERHFE6QFY46Q", "Satellite ID": "12L9ZFwhzVpuEKMUNUqkaTLGzwY9G24tbiigLiXpmZWKwmcNDDs", "Action": "GET", "Offset": 0, "Size": 92416, "Remote Address": "79.127.219.33:52670"}
2024-01-21T19:34:23+02:00	INFO	piecestore	download started	{"Piece ID": "OUVBDSSD6JFLHDNNPLHEDMN47LNH7ML225O3GSOSPF7CKMTAI5LA", "Satellite ID": "12EayRS2V1kEsWESU9QMRseFhdxYxKicsiFmxrsLZHeLUtdps3S", "Action": "GET", "Offset": 0, "Size": 14080, "Remote Address": "79.127.220.99:45944"}
2024-01-21T19:34:23+02:00	ERROR	services	unexpected shutdown of a runner	{"name": "piecestore:monitor", "error": "piecestore monitor: timed out after 1m0s while verifying writability of storage directory", "errorVerbose": "piecestore monitor: timed out after 1m0s while verifying writability of storage directory\n\tstorj.io/storj/storagenode/monitor.(*Service).Run.func2.1:176\n\tstorj.io/common/sync2.(*Cycle).Run:160\n\tstorj.io/storj/storagenode/monitor.(*Service).Run.func2:165\n\tgolang.org/x/sync/errgroup.(*Group).Go.func1:75"}
2024-01-21T19:34:24+02:00	ERROR	piecestore	download failed	{"Piece ID": "BWCU5IJLLYT3ZMFHATXEAAKPNE23DBY6PSJBZ5N5IIR5N3XISWOA", "Satellite ID": "12EayRS2V1kEsWESU9QMRseFhdxYxKicsiFmxrsLZHeLUtdps3S", "Action": "GET", "Offset": 0, "Size": 147456, "Remote Address": "103.214.68.73:59806", "error": "write tcp 10.2.0.2:34887->103.214.68.73:59806: use of closed network connection", "errorVerbose": "write tcp 10.2.0.2:34887->103.214.68.73:59806: use of closed network connection\n\tstorj.io/drpc/drpcstream.(*Stream).rawFlushLocked:401\n\tstorj.io/drpc/drpcstream.(*Stream).MsgSend:462\n\tstorj.io/common/pb.(*drpcPiecestore_DownloadStream).Send:349\n\tstorj.io/storj/storagenode/piecestore.(*Endpoint).sendData.func1:861\n\tstorj.io/common/rpc/rpctimeout.Run.func1:22"}
2024-01-21T19:34:38+02:00	WARN	servers	service takes long to shutdown	{"name": "server"}
2024-01-21T19:34:38+02:00	INFO	servers	slow shutdown	{"stack": "goroutine 944 [running]:\nstorj.io/storj/private/lifecycle.(*Group).logStackTrace.func1()\n\t/go/src/storj.io/storj/private/lifecycle/group.go:107 +0x71\nsync.(*Once).doSlow(0xc004fa1500?, 0xc000396540?)\n\t/usr/local/go/src/sync/once.go:74 +0xbf\nsync.(*Once).Do(...)\n\t/usr/local/go/src/sync/once.go:65\nstorj.io/storj/private/lifecycle.(*Group).logStackTrace(0xc000217eb8?)\n\t/go/src/storj.io/storj/private/lifecycle/group.go:104 +0x3c\nstorj.io/storj/private/lifecycle.(*Group).Run.func1({0x1225658?, 0xc000295f20?})\n\t/go/src/storj.io/storj/private/lifecycle/group.go:77 +0x2a5\nruntime/pprof.Do({0x1225888?, 0xc000074780?}, {{0xc0006bdf00?, 0xc000217fd0?, 0x78bc25?}}, 0xc0006b0f40)\n\t/usr/local/go/src/runtime/pprof/runtime.go:51 +0x9d\ncreated by storj.io/storj/private/lifecycle.(*Group).Run in goroutine 7\n\t/go/src/storj.io/storj/private/lifecycle/group.go:64 +0x509\n\ngoroutine 1 [syscall, 936 minutes, locked to thread]:\nsyscall.SyscallN(0x7ff9481c5f10?, {0xc000095cc0?, 0x3?, 0x0?})\n\t/usr/local/go/src/runtime/syscall_windows.go:544(...God, too long to even post here...)

nothing, beside 10 minutes earlier in events some Windows Defender changin’ some priorities for itself, scheduling itself for some restrat later, crazy stuff!
That theres constant action in the background of a Windows 10, its a f’kn spyware…

For that reason i suspect a Win10 update activity’s are crashing a storagenode.
i restarted the Windows, and got some updates BS popup window, so yeah, M$ definitely had his fingers in it!

I’m looking, im looking, and “Aha, Got it!”
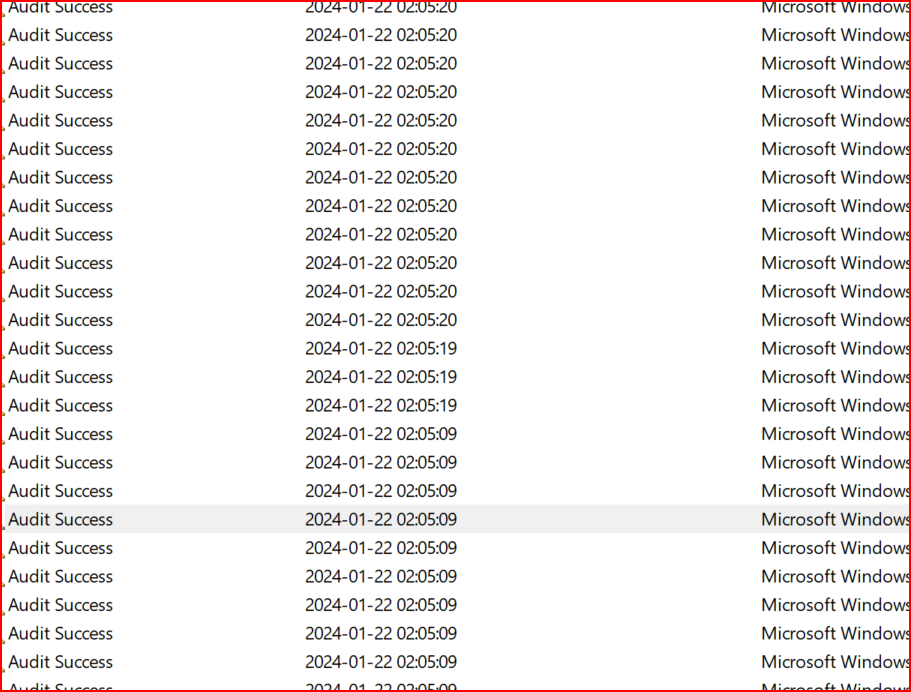
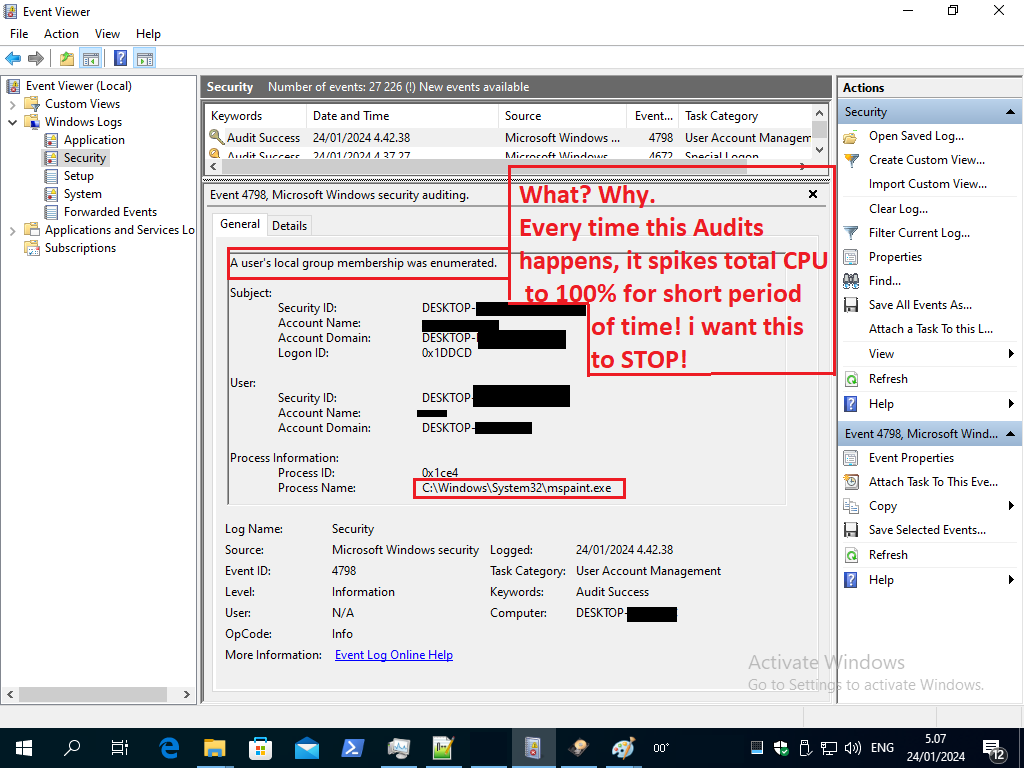
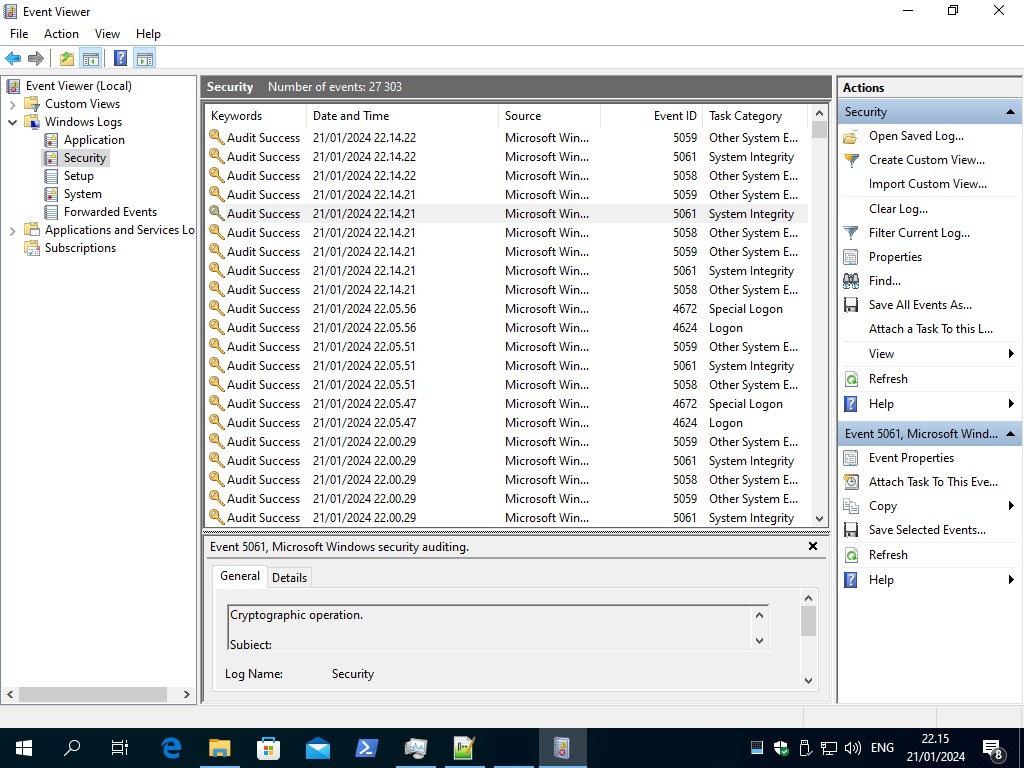
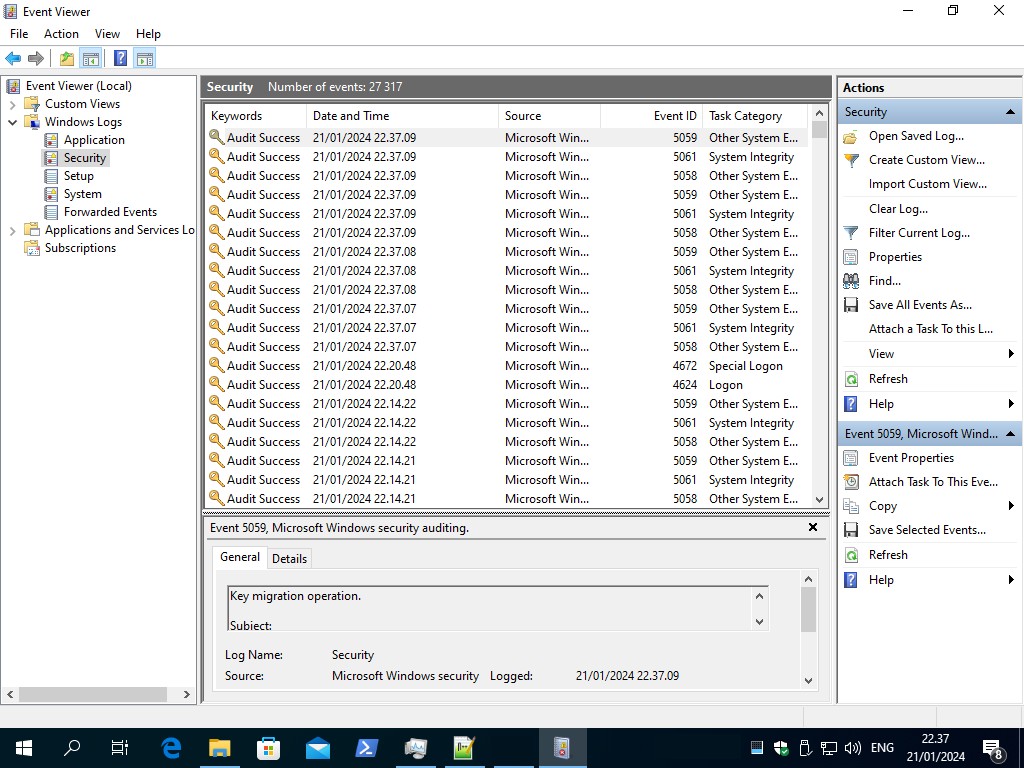
i noticed that in event viewer the amount of “Audit Success” under “Windows logs” folder, are a lot more often, every 5 minuets or so, than under windows instances where problem of CPU spike does not occures, there is a few only Microsoft Windows security audits (with key icon) , and much fewer, every few hours, not minutes!

i kept watching,

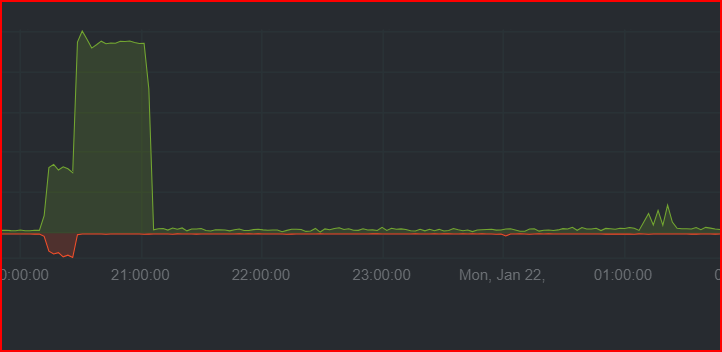
At 22:00, CPU spike 100% for storagenode.exe again,
and HDD activities to 0, for some long 20-30-40sec
did not crashed, but i see how it could!


Event viewer shows again a Microsoft Security Audit Success at 22:00
a 9 of them, and before at 21:50.
Lets wait to 22:10 and see if it will occure again…
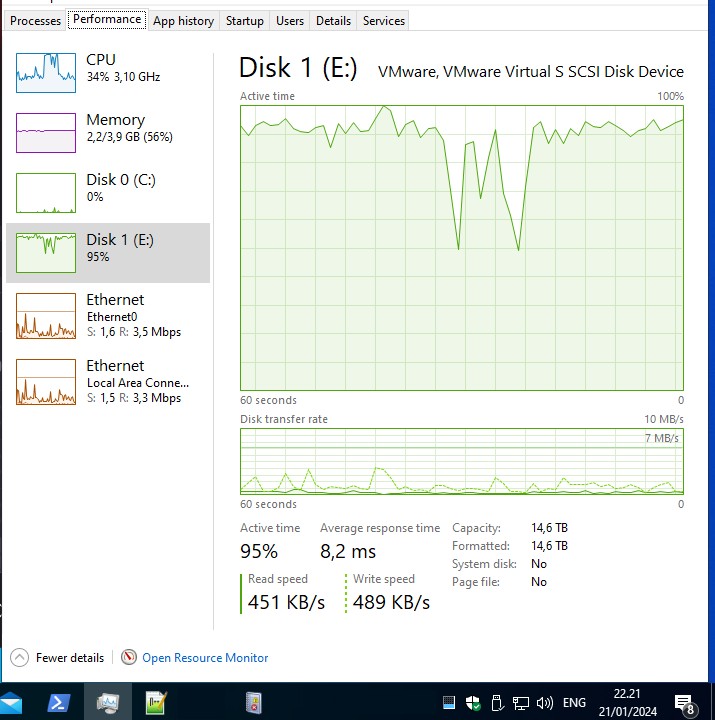
nothing untill 22:20
CPU went 100% but for a few sec only,


So i waited more.
22:34 couldn’t wait to see, but nothing happened,
i closed the event viewer, and just after that
the CPU finally started to rise

.
and this time, the storagenode didn’t survive that…
after 120 sec as set, it was restarted, but still,
that often restarts, turns into failure all filewalker efforts…


.
it shows 22:37 here, but it started at 22:34 and lasted to some 22:35, 22:36, and i see the posts in event viewer are little late than in fact occurred, but im sure its correlated now!


Everytime the CPU goes to 100%, this audits begins!
This happens only on 3 nodes i observe, and rest 10 nodes are not affected.
I can see that on not affected nodes, these audits happens much less often!

At this time the affected node is at risk to restart every few hours,
not sure what to do with that, to look to disable those audits? or tamper them, how?..

1 Like

Hmm, i have idea… about those updates for now.
Do you have folder where node keeps files excluded from MS-Defender scan?
Also OS file indexing services? (Windows isn’t alone here, linux GUI uses same indexing crap)

Windows Auditing spam on my OS right now (no storj node):

That’s the reason of the service stops, the disk subsystem is slow (of course, because it’s virtualized). So you need to Defrag this disk and enable the autodefrag back if you disabled it.
You may also exclude the storage location from defender’s scans.
After that you likely will need to increase a writable check timeout:

Increase it until it will not crash anymore. If you will be forced to increase it more than 5 minutes, you should also increase the writable check interval (it’s 5m0s by default):

# how frequently to verify writability of storage directory (default 5m0s)
storage2.monitor.verify-dir-writable-interval: 5m30s
1 Like

Don’t be biased. All the rest 10 nodes are in same situation, yet no such problem.
However, thank You. You explained why sometimes it crashes and sometimes not,
i think the HDD work was stopped for more than 1minute in that crash case!

And it was stopped as a result of that system actions, this “Audits”.
its system action, or its something that presents itself as systems…
i don’t know yet for sure, i think its Win10’s fault alone.
because no problem with other .exe’s,
if that would be malware, would attack more i guess…

aha, again 4:08 node crashed, and surprise surprise 10 adudist of security BS at 4:08 …

so i made it

storage2.monitor.verify-dir-writable-timeout: 2m0s

and will see if that helps!
but those Audits man, WHY, whats wrong with this windows people… want to audit everything with broken tools!..

@Dunc4n1d4h0 whole Storj HDD is exluded from stupid Windows Defender, but storagenode.exe is on C:, a SSD, You think to exlude storj installation folder as well?
i mean this will exlude from scans, but those audits? i dont think so those audits listen to exlude options like scans…

You may exclude storagenode.exe and maybe storagenode-updater.exe only.

Definitely, you do not want to get your storagenode.exe deleted because MS thinks its crap…

but this will cause the orders, to be scanned?

Yes, then you may exclude the entire "C:\Program Files\Storj\Storage Node" directory.

I didn’t that for my Windows node and doesn’t have issues like this. However, it’s not virtual.

If you trust Storj for not putting malware in their releases, you should exclude entire directories/folders from scanning, aka the storagenode installation dir and the storage dir. When I ran my windows node, I excluded them from the start, not waiting for av to pop up; but I use licensed av, not Defender.
I wonder if the audits start before node crash or afer it restarts? It’s normal to start scanning a new process, even if it’s the same exe that just restarting. But if it’s after restart, it means that Defender dosen’t kill the node. I didn’t watch the pics you posted, maybe the answear is there. :blush:

Hmm, I checked my node with Netdata monitoring installed. That is linux vm with nothing more than storj running on it. And more important it’s full node, not accepting uploads from outside.
cpu (top flat line is 50%, so probably 1 core of 2 at 100%)


disk (lvm volume on raid5)

As you can see it has random spikes in cpu & disk usage (probably some filewalkers and garbage collector crap)… so maybe it’s just “normal”.

btw, I would not exclude storj executables from scan, you can’t be sure what vurnerable packages hide inside, but on the other hand if av deletes storj.exe that’s bad too :smiley: . But you should exclude folders where all data are, to avoid disk usage from av scan after updates.

Whether storagenode.exe causing Microsoft Windows Security audits to audit, or Audits itself cause storage node to spike CPU, changing from writability-timeout from 1m0s to 2m0s helped storagenode to survive that CPU spikes and not crash so far on 2 nodes. (CPU spike lasted less than 2 minutes)

Wonder what those Audits are and what triggers them
Those are the audits that occurred when storagenode crashed yesterday:
Are they nessesary? can this be dissabled?

Is the drive encrypted?

Not that i did anything intentional?
just a Windows 10 PRO in a virtual machine (VMware Workstation)
I did NOT install anything for disk encryption.

Kind of expected, because of

it is. But @Ruskiem doesn’t use a software RAID, however, they uses the virtualization, so it may affect the CPU load too.

Likely the slow disk subsystem causes higher CPU load. In Linux it’s usually IOWait, not the actual load, the CPU just busy waiting for response.
You may use this metric to see, is it a case for you:

1 Like

Thank You Alex, Your help is as always priceless.
Tho You keep saying about slow disk or subsystem, so i just did a HDTune Pro test inside a VM to show You that’s not the case, that this 16TB, enterprise grade, helio sealed HDD: Ultrastar HC 550, produced in 2020 or 2021 is defective…

While storagenode was working and around 6,91TB full
i ran this read benchmark, over whole 16TB space:


.
^^^^
Access time during the brust rate part is 17.4ms, over whole HDD, while node is working? thats decent.
You see volatility, because the node interrupts the benchmark with constant downloads and writes.

After a moment i ran it just over 40GB space, but then a CPU spike happens…


.
^^^^
“WMS Audit” stands for “Windows Microsoft Security Audit”

To be sure, i ran it again while no CPU spike:


.
Well okay… and acces time is very good: 8.89 bcoz it’s over a 40GB of space.
Next, suddenly the CPU spike happens!
so i quickly ran it during the spike! :


.
^^^^^^^^^^^^^^^^^ this image, shows i ran the test when CPU was 100%,
this is what the windows manager showed, and dedicated Storj’s HDD activity dropped to 0% at the same time, so i quickly start the benchmark.
The green square shows the part, where CPU % was back to normal suddenly (WMS Audits ended), and You can see the benchmark suddenly struggles more - this is because the storagenode starts using the disk again! and intensively trying to catch up!

It writes intensively, so it takes performance from the benchmark!
When it eventually catch up after a few seconds, the benchmark is returning to perform much better, just the volatility is back.

Since its only on 3-5 nodes, out of 13 total, i examined the Audit Policy , but coulnt find a settings corespondent to those Windows activity, and where to disable those audits!

I noticed that those audits, audit even a paint.exe, and every time they run, they spike CPU% to the MAX for short period of time! I can’t figure out yet how to turn those pesky audits off, or how to regulate it, all the settings in Audit policy looks like “no auditing” so wheres the settings for this?

In this case the Storagenode instance is a best testing system. If it crashes because of writable or readable timeout - that’s a proof of slow disk subsystem for random read/writes.

Any activity of system services could give you a high CPU usage in the VM. This is mostly the reason, why do you see it I guess. Try to dedicate a whole CPU core to the VM and you will likely see a huge difference in CPU usage.

Got those Windows 10 instances with storagenodes on them from like 2019 and 2020. never observed such behavior, never up to 100% because of some Windows Audits, and now, when ever there is maxed out CPU in VM, there is always an Windows Audit event in the logs around that CPU spike. (also i got whole core dedicated to each storagenode, 1 core/2 threads per VM (the cpu is quite strong, 8 cores/16 threads). So there must been some unfavorable changes, in windows security behavior i suspect. i stopped usless Win10 updates mostly by not alowing them, but security updates are ongoing all the time, i think Microsoft allowed some unfavorable updates, that causing this…

This is likely depends on how much space is used. I guess these nodes was not big three years ago.
But I would also agree, Windows become worse regarding bloating software from year to year…

Hmm, Interesting, lots going on here…

Summary thoughts - virtualization and disk issues - Malware / Virus - those audits you are concerned with are not the cause, they are meant to be on, but

  1. Microsoft Account Sign-in Assistant, and those other “windows named” services running under Storagenode is not correct, and would instantly make me think Virus, Malware or worse. The specific Microsoft Account sign-in assistant, is often an early stage attack vector on elevating account privilege.
  • Have you checked the Guest at all ? Lots of free tools out there, including;

Microsoft Safety Scanner

Manual Microsoft Malicious Software Removal tool

  1. What Hypervisor are you running ?

If it’s Esxi on bare metal, does the physical machine have realtek nic’s you are trying to use, and you happen to be on esxi 4.6 or older ?

If you are running Windows 10 on the physical machine, do you have Vmware Workstation Pro installed, or are you using multiple instances of Vmware Player ? If you are, again ensure the virtual disk images, if any are excluded from the virus scanner on the physical machine.

Why are you running Vmware on Windows 10 ? is this home edition or Pro ? If it’s Home edition, you will find better stability with virtual box, if it’s Pro then you will find better on Hyper-V.

  1. If you are running a Windows Operating System, as the host for your virtual machines, then you should not be using the 1st CPU + number of hard drives, as any form of processor affinity on your virtual machines, there will be issues :sunglasses: If you are just assigning 2 vCpu’s with no affinity, then it will be fine as there is no 1:1 mapping - This issues will relate to disk queues, and network queues and performance.

  2. The guests you have mentioned are Windows 10 Pro 1903 - that is old, very old - As OS Build 18362.836 is old - you will be getting basic updated to Windows defender only, you will not be getting all the features and detection of the latest defender releases, and you might find as per point 1, something has snuck in. The best course of action is to update Windows, as defender is very capable with live signatures from Azure / 365 and beyond to assist with zero day exploits.

  3. The event viewer events are not related, they are a side ways response to something else happening - for instance, windows firewall can generate Event 5061 on network interface change - this can be related to Esxi on Vmware 4.6 or older with bad network drivers - it can also been seen on some Intel Nic’s where hardware offload has to be disabled… The end result is this network flapping results in Windows Defender continually being invoked and a firewall reload occurs. Events 5061 and 5058 also relate to Windows update, you might find that your Windows Update catalogue is corrupted - you can find how to on deleting and recreating the catalogue online.

The windows Event system is capable of processing 1000’s of events, and will be highly unlikely to be the cause - however, if you feel you want to disable the audit logs - which are defaulted to enabled on windows 10 clients, then you can modify under local policy editor on;

HKLM\Computer\Windows Settings\Security Settings\Advanced Audit Policy Configuration

Again, I wouldn’t recommend switching this off, but it might assist you with limiting the areas to look at.

  1. The disk benchmark inside Vmware guests is not a true reflection of disk problems - it would be interesting to see a Crystal Disk Mark inside the guest, 4GB file, 5 passes on the random reads / writes - as this is more Storj.

  2. I can see some VPN bits in your screen-shots - for proper performance in virtualization, you need to ensure the CPU cryptographic hardware is passed through to the guests - this can either be in Host CPU passthrough, or advanced options to pass AES-NI or equivalent for you architecture - I have no idea where Vmware Workstation is with this being on or off now by default :confused: - failure to do this, will mean the VPN processing will be done by the CPU in software, slow and bad on performance will result impacting the guests and hosts if the VPN usage is extensive.

  3. Power management - Vmware will honour the default settings in Windows 10 guests, you should check the power plan is set to performance, else you can see some disk and CPU throttling occurring.

Hope something in there helps you find more the problem.

CP

3 Likes