Makes sense. Does any short TTL data in Storj-Global get directed/prioritzed to nodes that are running Hashstore (better suited for this data)?
Hello @RecklessD,
Welcome to the forum!
It’s not, because there is no such information on the satellites. We do not segregate nodes in Storj Global on any of their options, except belonging to /24 subnet of public IPs, but even then only by selecting a one node from such a subnet for each segment on uploads.
Also the success rate, reported by the customers, but it’s not specific to the nodes only to their performance related to serve customers requests.
This sure spends a lot of time compacting… Past 24hrs disk utilization on a 12TB hard drive with 6TB used.

Can you provide log lines from the hashstore for the period of these long compactions as well as your storagenode version? Also, do you have any STORJ_HASHSTORE environment variables set? This info should help me diagnose what’s going on. For comparison, I have my node with a 1TB stored finishing compactions in about 1 minute, so hopefully we can get yours down to about 6 minutes instead of 9 hours.
1 Like
Here’s a somewhat similar example.
- 2.5TB data stored on a 5 month old node.
- Almost daily compactions running 2-6 hours.
- ZFS pool with SSD cache.
- It has been running with hashstore since it became available, so it’s not a newly converted node.
- No environment variables, completely default settings.
Log is too long for pasting in this forum, but can be found here:
Thanks! Based on this and some other evidence, I’m going to consider changing the defaults for some values. If you want, can you set STORJ_HASHSTORE_COMPACTION_PROBABILITY_POWER=2 and STORJ_HASHSTORE_COMPACTION_REWRITE_MULTIPLE=10? That’s what I’m considering.
2 Likes
I’ve set the variables now, I’ll monitor the behaviour and see if it improves the situation.
Thanks you!
1 Like
When using docker is there variables I could use with the ‘docker run’ command like --storj_hashstore_compaction_probability_power=2 or maybe it’s just --hashstore_compaction_probability_power=2 ?
[edit]
Answer my own question.
I could use the docker -e option to the docker run command,
-e STORJ_HASHSTORE_COMPACTION_PROBABILITY_POWER=2 \
-e STORJ_HASHSTORE_COMPACTION_REWRITE_MULTIPLE=10 \
Now just wait and see if it makes any difference.
I’m running v1.126.2 and do not have any environmental variables set. It’s pretty much a stock config other than a few port number changes. I just converted from piecestore maybe 2 weeks ago. Drive is ext4, all default options other than changing reserved space from 5% default to 0%).
It compacted for 12hrs on 5/2. It has not compacted in the past 24hrs (yet). The logs have a lot of compact once started / compact once finished. This entry may be of interest -
2025-05-02T23:57:09-04:00 INFO hashstore finished compaction {“Process”: “storagenode”, “satellite”: “12EayRS2V1kEsWESU9QMRseFhdxYxKicsiFmxrsLZHeLUtdps3S”, “store”: “s1”, “duration”: “12h47m22.723204369s”, “stats”: {“NumLogs”:3263,“LenLogs”:“3.1 TiB”,“NumLogsTTL”:157,“LenLogsTTL”:“114.1 GiB”,“SetPercent”:0.9939881133302859,“TrashPercent”:0.09375355086111747,“Compacting”:false,“Compactions”:1,“TableFull”:0,“Today”:20211,“LastCompact”:20210,“LogsRewritten”:1059,“DataRewritten”:“1.0 TiB”,“Table”:{“NumSet”:16092801,“LenSet”:“3.1 TiB”,“AvgSet”:213664.24080394706,“NumTrash”:1416360,“LenTrash”:“302.0 GiB”,“AvgTrash”:228979.37532265807,“NumSlots”:33554432,“TableSize”:“2.0 GiB”,“Load”:0.4796028435230255,“Created”:20210,“Kind”:0},“Compaction”:{“Elapsed”:0,“Remaining”:0,“TotalRecords”:0,“ProcessedRecords”:0}}}
I’ll give the suggested compaction variables a try as well ![]()
Edit: Also maybe of interest, I have 4 nodes running and this is the only one showing this behavior. It is also the largest node at 6TB. The second is sitting around 4TB and the other 2 are brand new, around 400GB on each.
Yeah, that line indicates it has rewritten 1.0TiB which is more than expected when storing 3.1TiB, so that’s potentially odd depending on node uptime. edit: the beginning log line for that compaction would also help if you have it because then we could see how much data that individual compaction rewrote rather than just the full total.
Found the beginning log entry -
Why does it say 3.2TB though, the WebUI is reporting 6.16TB used and a du -h of the hashstore directory is showing 6.2TB used.
2025-05-02T11:09:46-04:00 INFO hashstore beginning compaction {“Process”: “storagenode”, “satellite”: “12EayRS2V1kEsWESU9QMRseFhdxYxKicsiFmxrsLZHeLUtdps3S”, “store”: “s1”, “stats”: {“NumLogs”:3310,“LenLogs”:“3.2 TiB”,“NumLogsTTL”:120,“LenLogsTTL”:“70.8 GiB”,“SetPercent”:0.9919627727349091,“TrashPercent”:0.07948056855450283,“Compacting”:false,“Compactions”:1,“TableFull”:0,“Today”:20210,“LastCompact”:20208,“LogsRewritten”:436,“DataRewritten”:“402.9 GiB”,“Table”:{“NumSet”:16375063,“LenSet”:“3.2 TiB”,“AvgSet”:211743.59779098255,“NumTrash”:1050328,“LenTrash”:“258.7 GiB”,“AvgTrash”:264505.0180134206,“NumSlots”:33554432,“TableSize”:“2.0 GiB”,“Load”:0.48801490664482117,“Created”:20208,“Kind”:0},“Compaction”:{“Elapsed”:0,“Remaining”:0,“TotalRecords”:0,“ProcessedRecords”:0}}}
There are actually 2 stores (s0 and s1) per satellite.
3 Likes
I migrated my 5TB node to hashstore. Now the gui lists 588GB for trash.
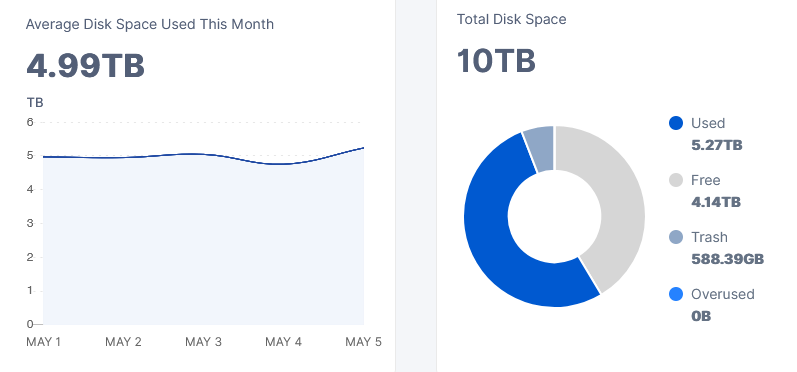
Filesystem Sizes:
blobs: 0 bytes, 0 files, 4100 folder
garbage: 0 bytes, 0 files, 0 folder
hashstore: 5.44TB (5,977,518,939,386bytes), 5736 files, 1564 folder
piece_expirations: 678.2kb, 10 files, 4 folders
temp: 16mb, 5 files
trash: 23bytes, 1 files, 4 folders
Now my question: why is the gui so much away from actual stats. Is there a db file, which I have to manually delete?
I am running storj v1.126.2 on docker.
Have a nice evening!
In hashstore I don’t think you see garbage separate on disk anymore? Like it stays baked-in to the 1GB logs until the system thinks it’s time for compaction? You may actually have 588GB of garbage: and that would be fine.
2 Likes
… so it’s been running for a couple of days with the suggested environment variables set.
Here’s the results:
2025-05-06T01:00:21Z    INFO    hashstore       compaction acquired locks       {"Process": "storagenode", "satellite": "12EayRS2V1kEsWESU9QMRseFhdxYxKicsiFmxrsLZHeLUtdps3S", "store": "s0", "duration": "1m0.443476236s"}
2025-05-06T01:00:24Z    INFO    hashstore       compaction computed details     {"Process": "storagenode", "satellite": "12EayRS2V1kEsWESU9QMRseFhdxYxKicsiFmxrsLZHeLUtdps3S", "store": "s0", "nset": 3143857, "nexist": 3326118, "modifications": true, "curr logSlots": 23, "next logSlots": 23, "candidates": [3388, 3387, 3428, 3668, 3573, 3411, 3878, 3341, 3671, 3383, 3429, 3566, 3064, 3665, 3393, 3399, 3565, 3829, 3788, 3577], "rewrite": [3064, 3668, 3341, 3665, 3383, 3566, 3788, 3565, 3428, 3878, 3577, 3399, 3429, 3411, 3393, 3829, 3573, 3388, 3387, 3671], "duration": "3.00893231s"}
2025-05-06T01:08:53Z    INFO    hashstore       compact once finished   {"Process": "storagenode", "satellite": "12EayRS2V1kEsWESU9QMRseFhdxYxKicsiFmxrsLZHeLUtdps3S", "store": "s0", "duration": "8m31.471333956s", "completed": true}
2025-05-06T01:08:53Z    INFO    hashstore       finished compaction     {"Process": "storagenode", "satellite": "12EayRS2V1kEsWESU9QMRseFhdxYxKicsiFmxrsLZHeLUtdps3S", "store": "s0", "duration": "9m31.915135753s", "stats": {"NumLogs":1037,"LenLogs":"1.0 TiB","NumLogsTTL":65,"LenLogsTTL":"16.5 GiB","SetPercent":0.9340921745821089,"TrashPercent":0.0415798473403667,"Compacting":false,"Compactions":0,"TableFull":0,"Today":20214,"LastCompact":20214,"LogsRewritten":20,"DataRewritten":"3.9 GiB","Table":{"NumSet":3143857,"LenSet":"0.9 TiB","AvgSet":314935.8587181287,"NumTrash":265834,"LenTrash":"44.07 GB","AvgTrash":165793.510235711,"NumSlots":8388608,"TableSize":"512.0 MiB","Load":0.3747769594192505,"Created":20214,"Kind":0},"Compaction":{"Elapsed":0,"Remaining":0,"TotalRecords":0,"ProcessedRecords":0}}}
2025-05-06T10:33:04Z    INFO    hashstore       compaction acquired locks       {"Process": "storagenode", "satellite": "12EayRS2V1kEsWESU9QMRseFhdxYxKicsiFmxrsLZHeLUtdps3S", "store": "s1", "duration": "6m55.245241464s"}
2025-05-06T10:33:10Z    INFO    hashstore       compaction computed details     {"Process": "storagenode", "satellite": "12EayRS2V1kEsWESU9QMRseFhdxYxKicsiFmxrsLZHeLUtdps3S", "store": "s1", "nset": 2394468, "nexist": 2522889, "modifications": true, "curr logSlots": 23, "next logSlots": 23, "candidates": [2558, 2466, 2492, 2553, 2490, 2559, 2541, 2487, 2483, 2650, 2576, 2566, 2560, 2565, 2564, 2633, 2585, 2471, 2484, 2489], "rewrite": [2633, 2484, 2559, 2487, 2650, 2560, 2490, 2541, 2566, 2553, 2576, 2564, 2585, 2471, 2558, 2466, 2565, 2483, 2489, 2492], "duration": "5.580222179s"}
2025-05-06T10:33:15Z    INFO    hashstore       compact once finished   {"Process": "storagenode", "satellite": "12EayRS2V1kEsWESU9QMRseFhdxYxKicsiFmxrsLZHeLUtdps3S", "store": "s1", "duration": "10.877120949s", "completed": true}
2025-05-06T10:33:15Z    INFO    hashstore       finished compaction     {"Process": "storagenode", "satellite": "12EayRS2V1kEsWESU9QMRseFhdxYxKicsiFmxrsLZHeLUtdps3S", "store": "s1", "duration": "7m6.123011158s", "stats": {"NumLogs":651,"LenLogs":"608.9 GiB","NumLogsTTL":45,"LenLogsTTL":"10.3 GiB","SetPercent":0.9440838015136032,"TrashPercent":0.0639298252831118,"Compacting":false,"Compactions":0,"TableFull":0,"Today":20214,"LastCompact":20214,"LogsRewritten":20,"DataRewritten":"0 B","Table":{"NumSet":2394468,"LenSet":"574.8 GiB","AvgSet":257760.80145652394,"NumTrash":218412,"LenTrash":"38.9 GiB","AvgTrash":191356.1332527517,"NumSlots":8388608,"TableSize":"512.0 MiB","Load":0.2854428291320801,"Created":20214,"Kind":0},"Compaction":{"Elapsed":0,"Remaining":0,"TotalRecords":0,"ProcessedRecords":0}}}
TLDR; Duration of compaction is down from several hours to ~10 minutes.
10 Likes
Nice! Maybe they should make them the default settings.
I think there should be consensus found, because on other hand, node can be full of trash, and not get new data because of it.
Already done 4 days ago. Which is no supprise because it was the intention when asking for testing these values.
4 Likes
Pff… I just recreated 2 containers with those. Now I’ll rerecreate them without. ![]()
For now you still have to apply these values yourself since the code change isn’t in the current release yet.
1 Like