The dashboard/API shows plenty of space left while the node does not receive any ingress anymore which I understand as it signals to the satellite that it is full. So one of the signals is wrong and makes it impossible as SNO to detect if the node is running as it should. As this condition can happen at any time, I would have to check frequently and continuously on the nodes, if the receive ingress despite the API showing me plenty of free space.
In the future, if HDD becomes obsolete and SSD or a newer version of cell storage becomes the standard in high capacity storage mediums, will the hashstore still matter and be the desired backend? Or we will go back to piecestore?
If that’s the case, and I’m pretty sure it will be, maybe we should not discard the piecestore code. Just put it in the closet for when the day comes.
Since I switched to hashstore, I had 3 node crashes in 2 months on 2 nodes, different machines, that required manual restart of the container. I never had this in 5 years of piecestore.
I don’t realy know what happened, the logs are not so helpful… some corrupted orders, some to-long-to-stop-container issues, etc. After restart, all is ok without errors logged.
It seems it’s more unstable than piecestore.
Just commenting here on some stats on hashstore “overhead”. Using the stbb tools one can do some digging for some stats of the hashtables and logfiles.
I have migrated all my nodes to hashstore several months ago. I have now found that, ignoring the data in the log files reserved for trash, with the default compaction settings (alive fraction of 0.25 and probability power 2), I observe ~12% of the log files are “dead” (i.e. space that can be reclaimed via compaction) on US1 data. Nodes vary from 8% to 14%.
Obviously this can change overtime. I’ve also observed it’s rare for compaction to take more than an hour. Using node logs over 4 months, 1% of the time a compaction will take over 1h, with the vast majority <15 minutes. I am now bumping most of my nodes to an alive fraction of 0.5, seems to have reduced the overhead to ~6%.
It would be nice to have a compaction routine, with a configurable integer M, for which on every compaction run it will compact at least the M most dead log files.
I use compaction 0.7 even 0.8 on some nodes
but hashstore.compaction.rewrite-multiple: 1 or 2-3
if node is small then better 1, because it needs les space for cleaning.
because if you dont have free space it cant clean at all.
Literally - while your disk has more than storage2.monitor.reserved-bytes, it will report the free space as a difference between the free space on the disk and storage2.monitor.reserved-bytes.
The node will report as full when the actual free space is close to the storage2.monitor.reserved-bytes amount.
Then the same logic of this actual used space is described as occupied by the live data, a trash and a garbage which could be compacted (reclaimable).
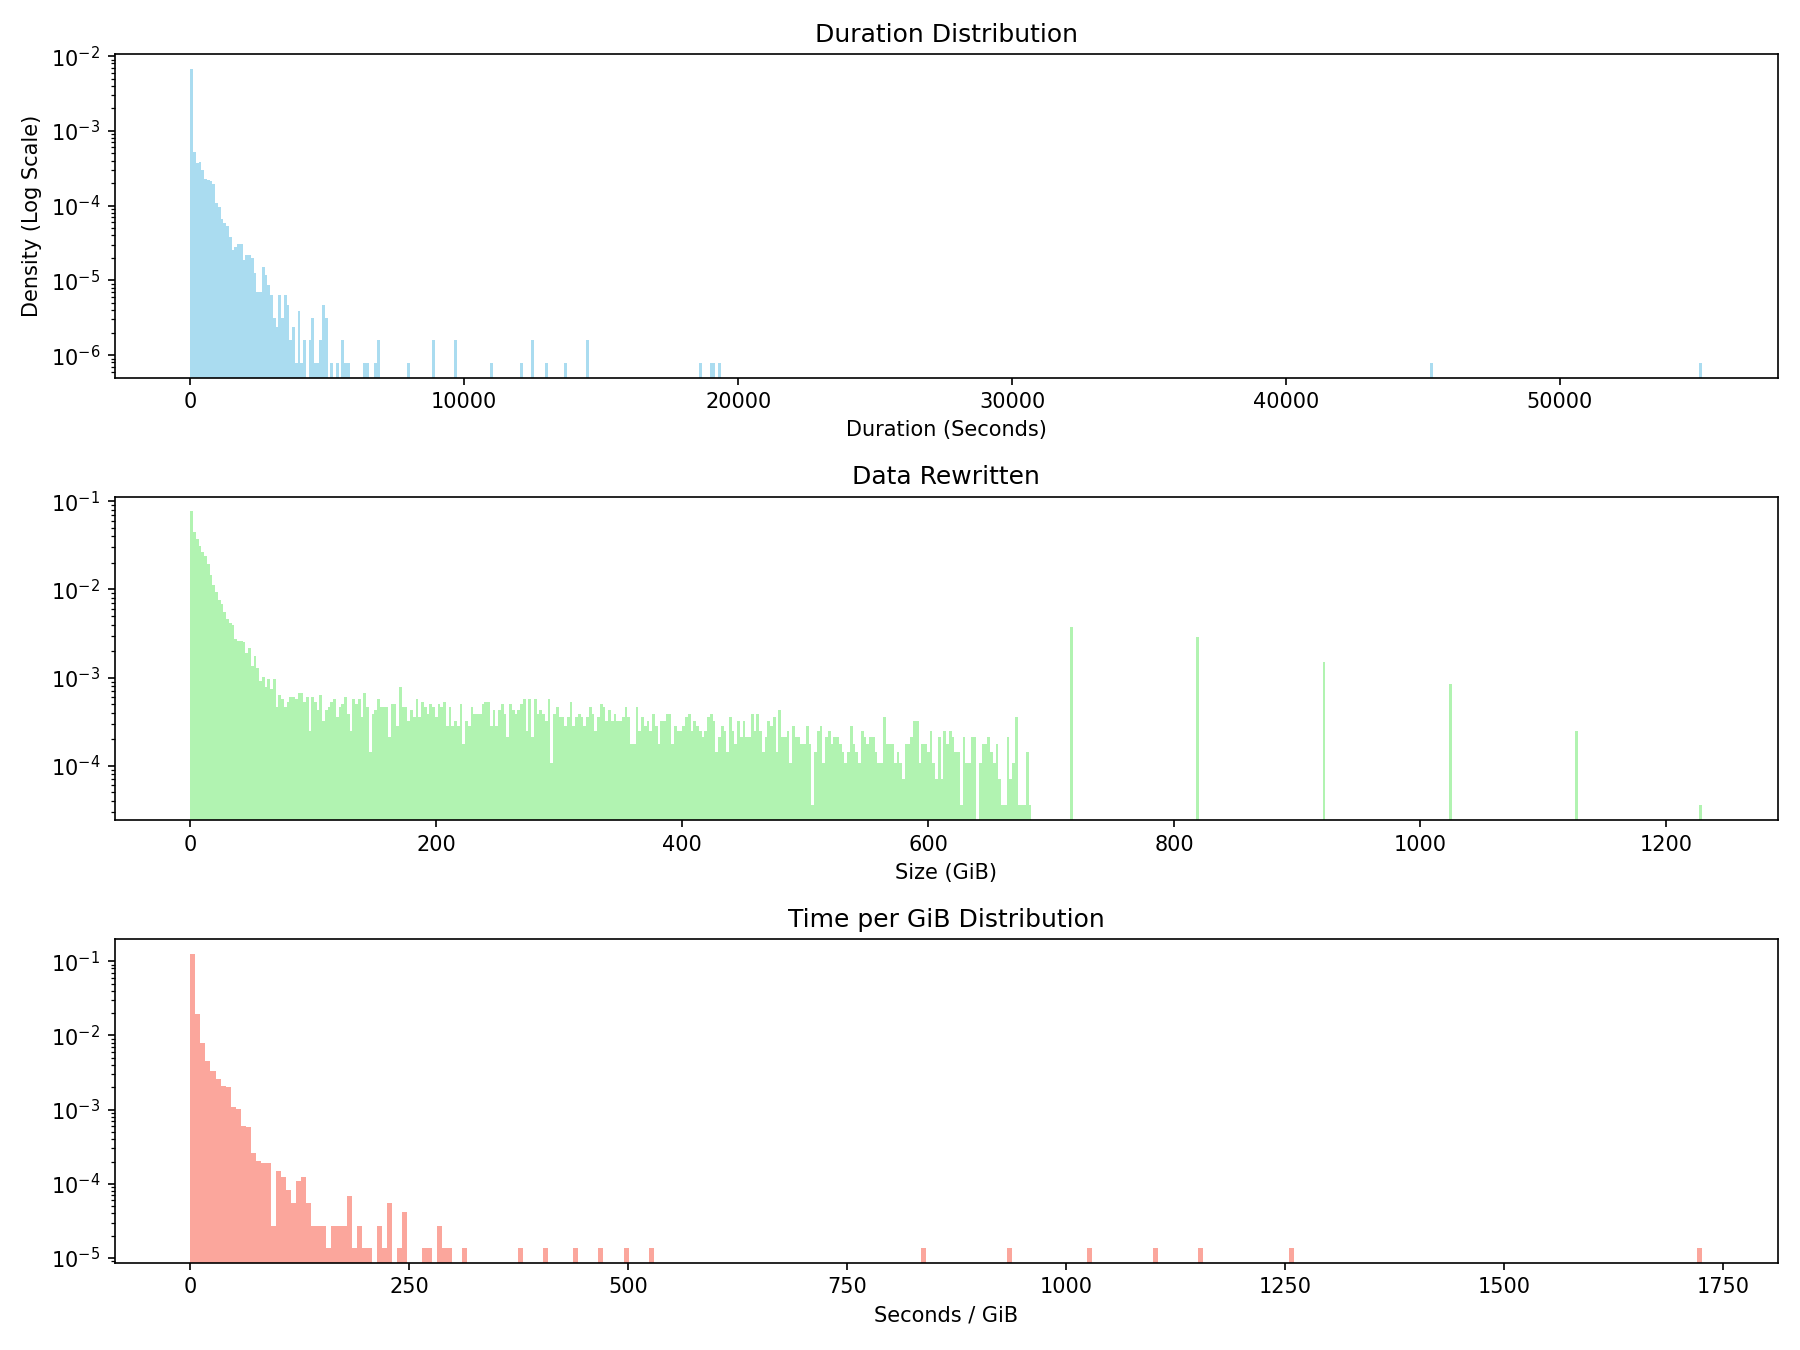
For the following chart below I’ve just grabbed the duration and stats.DataRewritten keys from the finished compaction logs. I’ve removed entries that have a data rewritten < 100MB.
Note the log scale on the y-axis. The mean duration is 271s and mean size is 85GiB.
So with hashstore obviously the individual files are larger, but what is the size of the piece that is read/written? Im trying to optimize my ZFS recordsize for this workload.
Changes over time. Do not optimize for that, because in a year this will no longer be valid. I remember seeing ~350 kB per piece in early 2024, which then slowly halved over the year to ~120 kB.
To get at least some idea about the current value, you could usually estimate the average size by looking at Storj-published stats, and divide the storage_remote_bytes by storage_remote_segments and by the smallest number of Reed-Solomon code parameters (currently 29), but recently stats became funky and report zeros. That would be a network-wide estimate, including pieces of different ages though—not representative of the distribution of pieces that get created now.
And specifically on my long-running nodes—again, might not be representative of the traffic right now—the average number ranges from 261 kB to 304 kB, plus or minus a negligible amount of non-piecestore files.