[Tech Preview] Email alerts with Grafana and Prometheus

I would like to setup email alerts for my storage nodes. It turns out the storage node already has a Prometheus endpoint. It is running on the debug endpoint /metrics. If you haven’t set the debug endpoint please visit Guide to debug my storage node, uplink, s3 gateway, satellite

I have already a Prometheus instance running and Grafana inclusive email alerts. Here are my configs:

docker-compose.yaml

version: "3.3"
services:
  prometheus:
    restart: unless-stopped
    user: 993:991
    ports:
      - 9090:9090/tcp
    image: prom/prometheus
    volumes:
      - /mnt/ssd/eth/prometheus:/prometheus
    command:
      - --storage.tsdb.retention.time=31d
      - --config.file=/prometheus/prometheus.yaml
  grafana:
    restart: unless-stopped
    user: 993:991
    ports:
      - 3000:3000/tcp
    image: grafana/grafana
    volumes:
      - /mnt/ssd/eth/grafana:/var/lib/grafana
    command:
      - -config=/var/lib/grafana/grafana.ini
  prometheus-exporter:
    restart: unless-stopped
    user: 993:991
    ports:
      - 9100:9100/tcp
    image: quay.io/prometheus/node-exporter
    volumes:
      - /:/host:ro,rslave
    command:
      - --path.rootfs=/host

prometheus.yaml

global:
  scrape_interval: 15s # By default, scrape targets every 15 seconds.
  scrape_timeout: 10s

# A scrape configuration containing exactly one endpoint to scrape:
# Here it's Prometheus itself.
scrape_configs:
   - job_name: 'prometheus-exporter'
     static_configs:
     - targets: ['prometheus-exporter:9100']
   - job_name: 'storagenodetest'
     metrics_path: /metrics
     static_configs:
     - targets: ['localhost:12019']
   - job_name: 'storagenode1'
     metrics_path: /metrics
     static_configs:
     - targets: ['localhost:13019']
   - job_name: 'storagenode2'
     metrics_path: /metrics
     static_configs:
     - targets: ['localhost:13029']

grafana.ini

[smtp]
enabled = true
host = smtp.gmail.com:587
user = <my gmail address>
password = <create new google app passwords>
;cert_file =
;key_file =
skip_verify = true
from_address = <my gmail address>
from_name = Grafana
# EHLO identity in SMTP dialog (defaults to instance_name)
;ehlo_identity = dashboard.example.com
[server]
root_url = http://localhost:3000

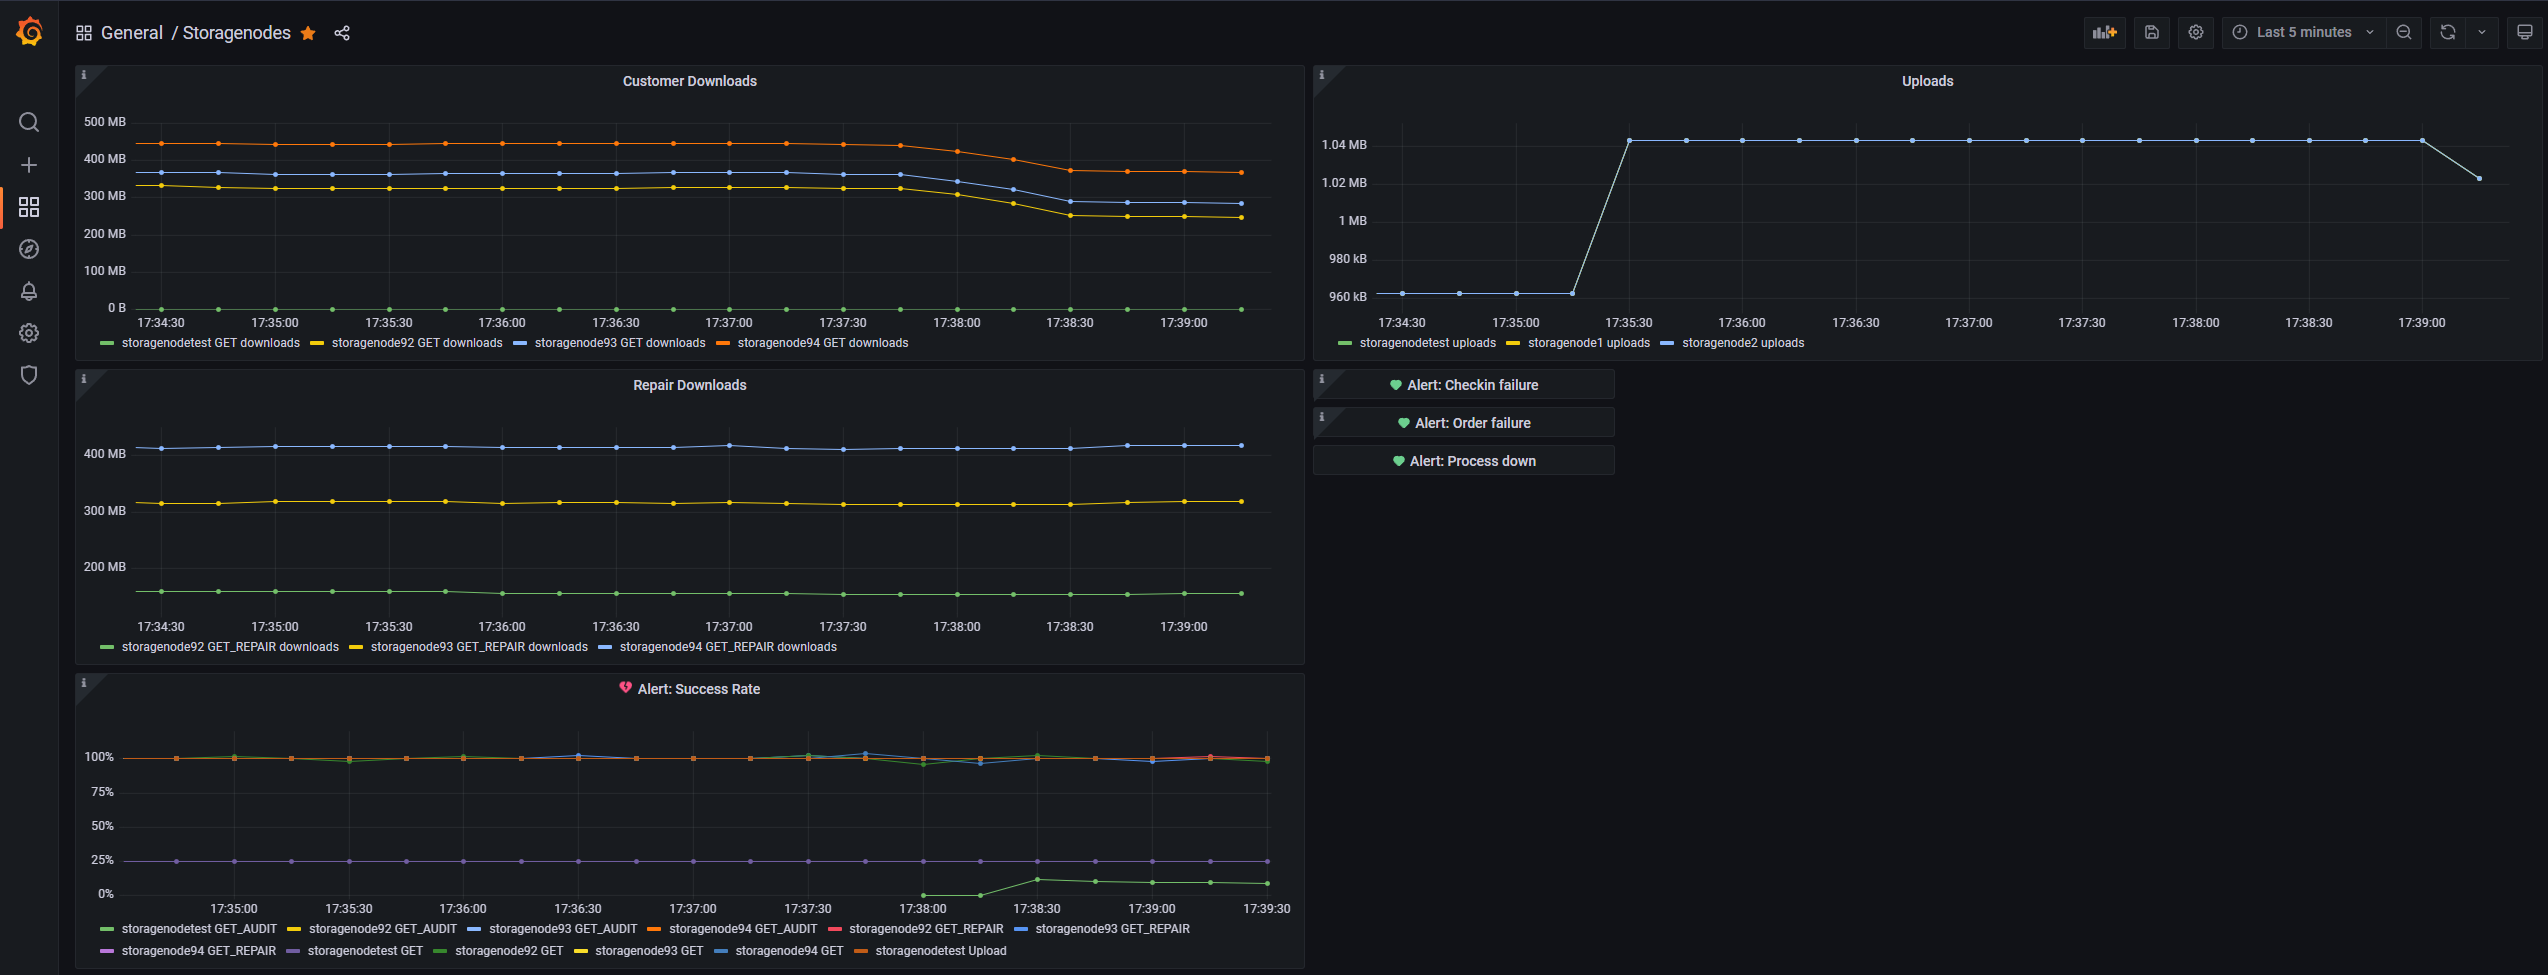
Up next we need a Grafana dashboard with email alerts. Let’s start with a first MVP. I am running multiple storage nodes and I want the email alert to tell me which node I need to fix. The trigger for the email alert doesn’t matter for this first MVP.

In a second step I would like to brainstrom with all of you which email alerts we need. For each email alert we also have to specify which data we need.
More than 5% audit failures (GET_AUDIT failed vs sucess)
More than 2 pending audits (GET_AUDIT started vs success + failed)
Audit score lower than 1
Suspension score lower than 1
Node process not running
Please write down which email alerts you want to see

The third step will be to expose the data we need for these email alerts. To be honest I will not have the time to make all the code changes myself. Instead my intension is to demonstrate how to do it and hopefully it is easy enough so that you can continue to keep the ball rolling. Ideally we have a living Grafana dashboard at the end that gets improved by the community over time.

6 Likes

I have configured zabbix to send me SMS for these reasons, maybe these would also be useful for you:

  • audit score lower than 1
  • suspension score lower than 1
  • node process is not running
  • node port is not accessible
  • new version is available
  • dmesg contains the words “blocked for more”

Also, it sends me notifications if cpu iowait % is too high, disk space is running out and similar (kind-of default Linux template for zabbix).

this is interesting, I’ll have to find a way to include this in my system.

4 Likes

Great ideas. I have added them to the list.

These might be a bit harder. I haven’t added them to the list yet. I think a good way to check open ports would be to watch the hourly checkin result.

I have the first MVP ready. It is not perfect but it sends me an email if my storage node is down or in a crash loop.

{
  "annotations": {
    "list": [
      {
        "builtIn": 1,
        "datasource": "-- Grafana --",
        "enable": true,
        "hide": true,
        "iconColor": "rgba(0, 211, 255, 1)",
        "name": "Annotations & Alerts",
        "target": {
          "limit": 100,
          "matchAny": false,
          "tags": [],
          "type": "dashboard"
        },
        "type": "dashboard"
      }
    ]
  },
  "editable": true,
  "fiscalYearStartMonth": 0,
  "gnetId": null,
  "graphTooltip": 0,
  "id": 11,
  "links": [],
  "liveNow": false,
  "panels": [
    {
      "alert": {
        "alertRuleTags": {},
        "conditions": [
          {
            "evaluator": {
              "params": [
                0.9
              ],
              "type": "lt"
            },
            "operator": {
              "type": "and"
            },
            "query": {
              "params": [
                "Storagenode1",
                "1m",
                "now"
              ]
            },
            "reducer": {
              "params": [],
              "type": "avg"
            },
            "type": "query"
          },
          {
            "evaluator": {
              "params": [
                0.9
              ],
              "type": "lt"
            },
            "operator": {
              "type": "or"
            },
            "query": {
              "params": [
                "Storagenode2",
                "1m",
                "now"
              ]
            },
            "reducer": {
              "params": [],
              "type": "avg"
            },
            "type": "query"
          },
          {
            "evaluator": {
              "params": [
                0.9
              ],
              "type": "lt"
            },
            "operator": {
              "type": "or"
            },
            "query": {
              "params": [
                "Storagenodetest",
                "1m",
                "now"
              ]
            },
            "reducer": {
              "params": [],
              "type": "avg"
            },
            "type": "query"
          }
        ],
        "executionErrorState": "alerting",
        "for": "0m",
        "frequency": "1m",
        "handler": 1,
        "message": "${job} Offline",
        "name": "${job} Offline",
        "noDataState": "alerting",
        "notifications": [
          {
            "uid": "vddsvqi7k"
          }
        ]
      },
      "datasource": null,
      "fieldConfig": {
        "defaults": {
          "color": {
            "mode": "palette-classic"
          },
          "custom": {
            "axisLabel": "",
            "axisPlacement": "auto",
            "barAlignment": 0,
            "drawStyle": "line",
            "fillOpacity": 0,
            "gradientMode": "none",
            "hideFrom": {
              "legend": false,
              "tooltip": false,
              "viz": false
            },
            "lineInterpolation": "linear",
            "lineWidth": 1,
            "pointSize": 5,
            "scaleDistribution": {
              "type": "linear"
            },
            "showPoints": "auto",
            "spanNulls": false,
            "stacking": {
              "group": "A",
              "mode": "none"
            },
            "thresholdsStyle": {
              "mode": "off"
            }
          },
          "mappings": [],
          "thresholds": {
            "mode": "absolute",
            "steps": [
              {
                "color": "green",
                "value": null
              },
              {
                "color": "red",
                "value": 80
              }
            ]
          }
        },
        "overrides": []
      },
      "gridPos": {
        "h": 8,
        "w": 12,
        "x": 0,
        "y": 0
      },
      "id": 4,
      "options": {
        "legend": {
          "calcs": [],
          "displayMode": "list",
          "placement": "bottom"
        },
        "tooltip": {
          "mode": "single"
        }
      },
      "targets": [
        {
          "exemplar": true,
          "expr": "up{job=\"storagenode1\"}",
          "instant": false,
          "interval": "",
          "legendFormat": "Storagenode1",
          "refId": "Storagenode1"
        },
        {
          "exemplar": true,
          "expr": "up{job=\"storagenode2\"}",
          "hide": false,
          "interval": "",
          "legendFormat": "Storagenode2",
          "refId": "Storagenode2"
        },
        {
          "exemplar": true,
          "expr": "up{job=\"storagenodetest\"}",
          "hide": false,
          "interval": "",
          "legendFormat": "storagenodetest",
          "refId": "Storagenodetest"
        }
      ],
      "thresholds": [
        {
          "colorMode": "critical",
          "op": "lt",
          "value": 0.9,
          "visible": true
        }
      ],
      "title": "Up",
      "type": "timeseries"
    }
  ],
  "refresh": "",
  "schemaVersion": 32,
  "style": "dark",
  "tags": [],
  "templating": {
    "list": []
  },
  "time": {
    "from": "now-5m",
    "to": "now"
  },
  "timepicker": {},
  "timezone": "",
  "title": "Storagenodes",
  "uid": "AA6sH8c7z",
  "version": 9
}
2 Likes

Today I would like to show you that it is very easy to expose new values for new alerts. Here is my PR: storagenode/piecestore: upload and download metrics for Grafana alerts by littleskunk · Pull Request #4280 · storj/storj · GitHub

This PR is not perfect. It is mixing up audit failures with all other download failures. It would be possible to get DQed for failing audits while still having a high customer download success rate. I hope someone else can follow up and improve the metric. Group by limit.Action would be awesome.

2 Likes

A new day and another good news. I have managed to set up an email alert for a low download success rate. It is defined as download success / download started. This alert will catch audit failures and also audit timeouts. I had an issue once that almost got my node disqualified. My node was opening a channel for an audit request (download started) but would never finish the audit in time. I am confident that the alert would catch that.

I managed to keep the dashboard and the alerts generic. You can throw any number of storage nodes at it and Grafana will send an email and tell you which of the storage nodes has an issue. However, if you don’t resolve the issue Grafana might drop that storage node after 48 hours and stop watching it.

And last but not least @clement has improved my PR. This will allow me to break down my download success on audit, repair and customer downloads. Today I want to improve my alert so it fires if any of these has a low success rate.

2 Likes

Final dashboard for this MVP:

It contains 7-8 alerts.

  • Storagenode not running
  • Storagenode unable to checkin including pingback error. This should cover any kind of communication issue in both directions like identity not signed, wrong external address or port forwarding not working. It would also fire if one of the satellite is unreachable.
  • Storagenode is unable to submit orders back to any satellite. Technically the storage node will retry every hour. An alternative alert rule would be to wait a few hours and see if the retry works before sending an email alert.
  • Low audit success rate (<95%). This and all following alert will also catch timeouts and fire an alert early while the operator can still stop the storage node and avoid a disqualification.
  • Low repair success rate (<95%). This can get you disqualified as well.
  • Low customer download success rate (<90%). No disqualification risk but I want to keep the success rate high. From time to time I test different tools on my system and one of them might reduce my download success rate which would result in a reduced payout. If I get email alerts I can find out early what is causing the lower success rate. Keep in mind this threshold will not work for everyone because of long tail cancelation.
  • Low upload success rate (<90%). Same deal. No disqualification risk.
  • Optional 8th alert (currently not implemented but possible with the same data). No upload or download activity for quite some time. I had that alert for a moment but I noticed that my testnet node would fire that alert a bit too frequently. In testnet uploads and downloads are not happening as frequently. If you want that alert upload and download started should do the trick. By combining the upload alert with available space you can make sure a full node doesn’t fire the alert. Keep in mind if the storage node has more than 500MB space available the next checkin might be an hour away.

The best for all of these alerts. The number of storage nodes doesn’t matter. The grafana dashboard will apply these email alerts on any number of storage nodes. As soon as one of the given storage nodes has a low audit success rate it will fire an email inclusive the name of the storage nodes.

5 Likes

Great deal!

Would you mind connecting Discord alternatively to an e-mail notification? (config Option) @littleskunk

Doing so, this is the right expertise in terms of content and another option to notify the SNO (much faster).

Personally I do not have to reinvent the wheel, too:

Feel free to replace the email alert with what ever you like. Grafana can push the alerts to a lot of applications.

1 Like

I have uploaded the JSON file for my dashboard here: Grafana Dashboard for Storagenodes · GitHub

The latest version is now watching delete queue, GC execution time and GC deleted pieces. I wanted to setup email alerts for these metrics as well but I am not sure about the threasholds yet.

1 Like

I have updated the email alert for download success rate. One of my nodes is holding some data from US customers but because of the long tail cancelation my download success rate is a bit lower. With an adjustment of the thresholds it works much better now.

30 minute time windows are working great for audits but not for customer downloads. I had a few downloads starting at the same time and they needed 5 minutes to finish. By increasing the tracking window to 6 hours these effects will come on top of a bigger number of otherwise successful downloads so that the success rate doesn’t drop below the threshold. Audits are still tracking with 30 minute window. They are usually finishing within seconds.

I improved my grafana dashboard. See screenshot below:

  1. Some stats around customer downloads over the last 24 hours, 7 days, and 30 days inclusive an estimation over 30 days for easy comparision. In my screenshot you can see that the last 24 hours had less download traffic than “normal”.

  2. Same for Repair + Audit traffic. Audit traffic is so low that I just called it repair traffic.

Note: I am counting only succcessful downloads. Canceled downloads are still paid. So at the end of the month, my numbers will be lower than my actual payout. That is something to worry about later if needed. It might require some code changes on the storage node side.

  1. Used space growth rate. In my head I calculated how much my storage node should grow based on the upload traffic but I don’t have numbers around customer deletes and garbage collection. Luckily the storage node is reporting the final used space and grafana can calculate how much used space I have now compared to 24 hours ago, 7 days ago and 30 days ago. Again with an estimation to compare these numbers. My growing rate across all storage nodes is currently 200 GB per month.

  2. Some overall stats. 8 TB total used space. 26 TB free space. With the current grow rate it will take me 10 years to fill my hard drives. This was the main idea for the current improvement. I could now go ahead and test out some alternative settings and see how that impacts my grow rate.

JSON file updated: Grafana Dashboard for Storagenodes · GitHub

4 Likes

Thanks to share @littleskunk. It’s really helpful.

I started to use it, unfortunately I had issues with importing it to my grafana. Looks like the hard-coded datasource doesn’t work very well: I removed the uid": "i3evvqinz" and it was better.

I think it can be fixed with using a variable for the datasource. Or do you have any workaround to handle this issue?

I have no idea. This is the first grafana dashboard I share. I was hoping someone else with more experience can tell me what I have to change.

I have a new update. Thanks to @clement the online and audit score is now available over the metrics endpoint as well: Grafana Dashboard for Storagenodes · GitHub

I have added it to my dashboard but have not set up any email alerts for it yet.

Instead, I spend some time making the graph more useful. It just takes 10 nodes with 3 scores each to make that graph hard to read. So now I just hide the 100% values. The result is a graph that just shows any node that has a lower score and I can watch it over time. In my case just 10 online scores that will hopefully get back to 100% at some point.

Up next I was planning to add the estimated payout. I believe that is not available over the metrics endpoint yet. It would be fun to track the estimation over time :smiley:

I have also thought about more details around unpaid garbage space. @clement changed the used space graph on the storage node dashboard. If I can get a copy of the last used space value I could compare it with the used space from my storage node. The difference between both values should be unpaid dead space that will get cleaned up sometime in the future by garbage collection. The beauty of this would be that I can prepare for extensive garbage collection runs. It would also be more live. I might be able to find out which of my actions are creating garbage in the first place. Waiting for the garbage collection to run will add a time delay that makes this kind of observation impossible.

3 Likes

The delete queue can be deleted now because of some recent code changes.

Garbage collection might take a week to show up.

2 Likes

Could you try again with pieces.enable-lazy-filewalker: true ? In theory that should fix your problem.