That path is unique per install. It should probably be noted somewhere to either update that path, or variable-ize it. I don’t think an issue in Github is needed.
I certainly have updated the path to suit my environment, but nevertheless I get the error stated. When running the awk command outside of the script it runs fine, but not when executing the script manually or via telegraph. Not quite sure why that is.
They do populate for me. But i have data (or < or > 100% values) Previously if it matched 0 values you wouldn’t see data. ZumZoom on github has pushed a change to fix this. So you can pull the new successrates.sh to see charts populated at 100% values now. Ex: if you have 0 success, and 0 failed, your ratio is 100% success. Although if it never changes, there is a problem, but that can be detected in the trendline chart.
Also, for testing, you can add them to a list at the bottom of your chart and you can minimize / maximize for extended testing.
Hmm, found that it’s somewhat because I’m running this in a docker container, on unraid, which doesn’t support the “grep -P” option.
I’m thinking I can convert:
audit_failed_warn=$(grep -Pc ‘failed.*GET_AUDIT(?!.*open)’ $LOG)
to
audit_failed_warn=$(cat “$LOG” | grep GET_AUDIT | grep failed | grep -v open -c)
But I’m not sure that’s the right statement, as I’m not a pro at regex and negative lookaheads. Can someone verify if that’d be correct?
Also:
version=$(tac $LOG|grep -oPm1 ‘(?<=v)(\d{1,3}.){2}\d{1,3}’)
to
version=$(cat “$LOG” | egrep -o “v[[:digit:]]{1,3}.[[:digit:]]{1,3}.[[:digit:]]{1,3}” | tail -1 | egrep -o “[[:digit:]]{1,3}.[[:digit:]]{1,3}.[[:digit:]]{1,3}”)
Making those changes seems to make my script succeed and dashboard populate now. Now it’s just time to pretty it up some more ![]()

that issue may have been introduced when we pushed a change to reduce pipes for performance. Glad to see you’re back up! looks great!
So any tips getting the log-file to be parsed? Ref. the earlier post up here… Could it be a version-thing? Running the successrate.sh on an Ubuntu 16.04
I’ll also need to figure out a way to make it see the performance stats of the storj-host, instead of the TIG-host.
Maybe the easiest way to parse the log would be open for docker for remote access…
as far as awk not working, can you post the error msg displayed when running it manually?
Making Telegraf work within the container requires that it reach into another container, or onto the host for the logdata. the docker-compose.yml in the github is very close at accomplishing this, but it’s not complete yet. This is an upcoming feature.
Thanks. I tried tinkering a bit myself, and ended up with this working line to grab the log:
awk -v d="$(date -d'24 hours ago' +'%FT%T')" '$1" "$2>=d' /mnt/storagenode/storj/node.log >> $LOG
Now it reads it and populates the influxdb correctly 
Oh, btw, I am running telegraf and grafana as normal applications/services on a host, not in docker at all. Not quite what this projects targets, but got it to work at least
After some time ( about 12 hours) it stopped showing reports 
Can anyone help me figure out why?

It was working perfectly at first, but for no reason just stopped 
Never mind, fixed it by editing docker name in successrate.sh
I can not get any value about Disk Space and Bandwidth per month graphs:

looking my web dashboard this value are present:

on my telegraf.conf it seems correct on dashboard part:
[[inputs.exec]]
commands = [
“curl -s 10.1.0.200:14002/api/dashboard” # Open SNO API by mapping ports when running your SNO docker instance
]
timeout = “60s”
interval = “1m”
data_format = “json”
tag_keys = [ “data_nodeID” ]
name_override = “StorJHealth”
I saw this error on my telegraf log:
telegraf | 2020-04-15T12:21:00Z E! [inputs.exec] Error in plugin: invalid character ‘<’ looking for beginning of value
I noticed this after one of the recent releases too. I’ll try to look at it soon. To get the original contributor’s attn please also enter a GitHub issue
I’m running Telegraf Influxdb and Grafana on docker and I cann’t get the throughput of storagenode container do you now how i can setup the storagenode container interface value ?
Assuming your telegraf is collecting host data properly, you can change the network adapter monitored in the dashboard’s control settings. Default is docker0
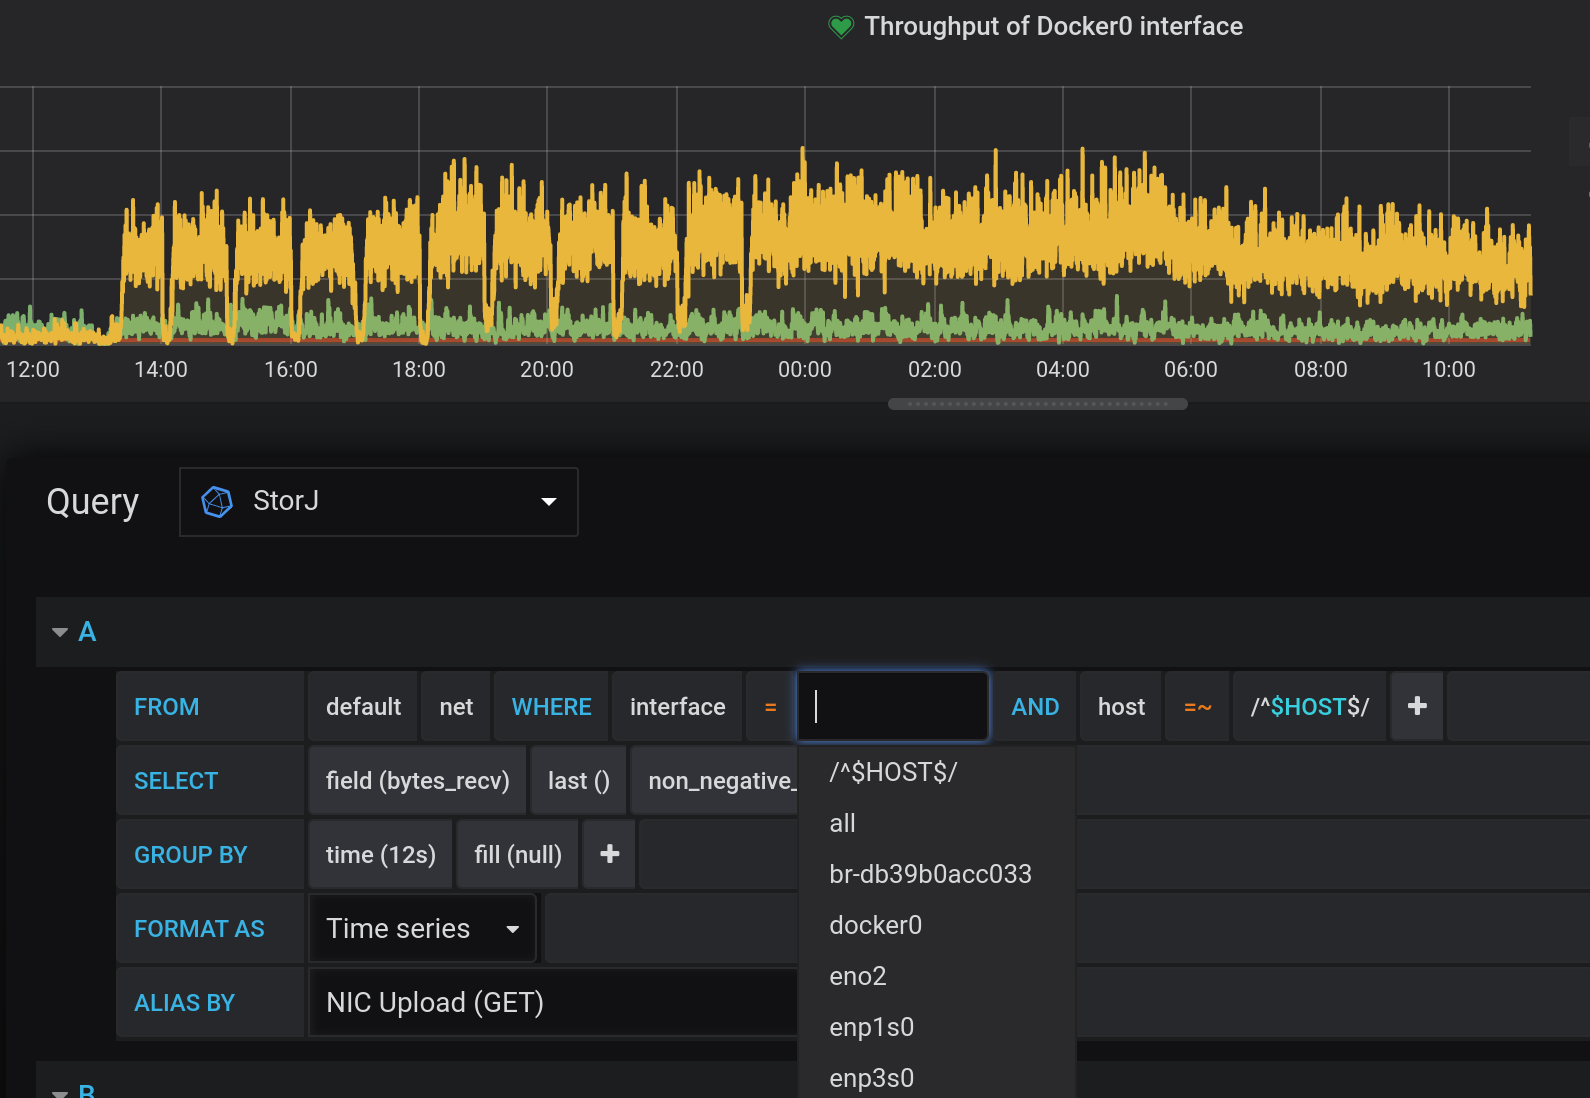

Try clicking docker0 (after interface=) and selecting another network interface. If none of them have data, your config file in telegraf is not collecting the correct data.
I have try all interfaces with no success, how can I check if telegraf is collecting this data ?
Ifconfig to check interface names. If there isn’t a docker0, change it in telegraf.conf.
[[inputs.net]]
## NIC Traffic Monitor
interfaces = ["docker0"]
Then test the plug-in to see if the data is exported that you need.
Test input plugins: telegraf --debug --config /etc/telegraf/telegraf.conf --input-filter exec --test
my telegraf.conf file is correct, I think that the correct command is ![]()
telegraf --debug --config /etc/telegraf/telegraf.conf --input-filter net --test
and I get this output:
2020-04-16T06:35:07Z I! Starting Telegraf 1.14.1
2020-04-16T06:35:07Z D! [agent] Initializing plugins
net,host=b52c0c936783,interface=all icmp_inaddrmaskreps=0i,icmp_inaddrmasks=0i,icmp_incsumerrors=0i,icmp_indestunreachs=0i,icmp_inechoreps=0i,icmp_inechos=0i,icmp_inerrors=0i,icmp_inmsgs=0i,icmp_inparmprobs=0i,icmp_inredirects=0i,icmp_insrcquenchs=0i,icmp_intimeexcds=0i,icmp_intimestampreps=0i,icmp_intimestamps=0i,icmp_outaddrmaskreps=0i,icmp_outaddrmasks=0i,icmp_outdestunreachs=0i,icmp_outechoreps=0i,icmp_outechos=0i,icmp_outerrors=0i,icmp_outmsgs=0i,icmp_outparmprobs=0i,icmp_outredirects=0i,icmp_outsrcquenchs=0i,icmp_outtimeexcds=0i,icmp_outtimestampreps=0i,icmp_outtimestamps=0i,ip_defaultttl=64i,ip_forwarding=1i,ip_forwdatagrams=0i,ip_fragcreates=0i,ip_fragfails=0i,ip_fragoks=0i,ip_inaddrerrors=0i,ip_indelivers=10i,ip_indiscards=0i,ip_inhdrerrors=0i,ip_inreceives=10i,ip_inunknownprotos=0i,ip_outdiscards=0i,ip_outnoroutes=0i,ip_outrequests=13i,ip_reasmfails=0i,ip_reasmoks=0i,ip_reasmreqds=0i,ip_reasmtimeout=0i,tcp_activeopens=2i,tcp_attemptfails=0i,tcp_currestab=1i,tcp_estabresets=0i,tcp_incsumerrors=0i,tcp_inerrs=0i,tcp_insegs=10i,tcp_maxconn=-1i,tcp_outrsts=0i,tcp_outsegs=13i,tcp_passiveopens=0i,tcp_retranssegs=0i,tcp_rtoalgorithm=1i,tcp_rtomax=120000i,tcp_rtomin=200i,udp_ignoredmulti=0i,udp_incsumerrors=0i,udp_indatagrams=0i,udp_inerrors=0i,udp_noports=0i,udp_outdatagrams=0i,udp_rcvbuferrors=0i,udp_sndbuferrors=0i,udplite_ignoredmulti=0i,udplite_incsumerrors=0i,udplite_indatagrams=0i,udplite_inerrors=0i,udplite_noports=0i,udplite_outdatagrams=0i,udplite_rcvbuferrors=0i,udplite_sndbuferrors=0i 1587018907000000000