In my logs I see a lot of 256 byte downloads which are parts from much bigger pieces. Those downloads are normal GET, not GET_AUDIT. This makes no sense to me, what could be the purpose of such downloads?
You forgot your own post ![]()
If it’s different pieces and different offset, it’s probably integrity checks of “cold backups” ?
In that case the check would normally just download a small portion of the file and check the context against expected value - much like the audit system in StorJ does it.
If it’s the same piece, it would be a tool comparing files for changes to check if a fresh cache copy is needed.
But, really, this is speculations - there are so many different usecases that could cause such behavior ![]()
But for comparison, I’ve checked a couple of nodes.
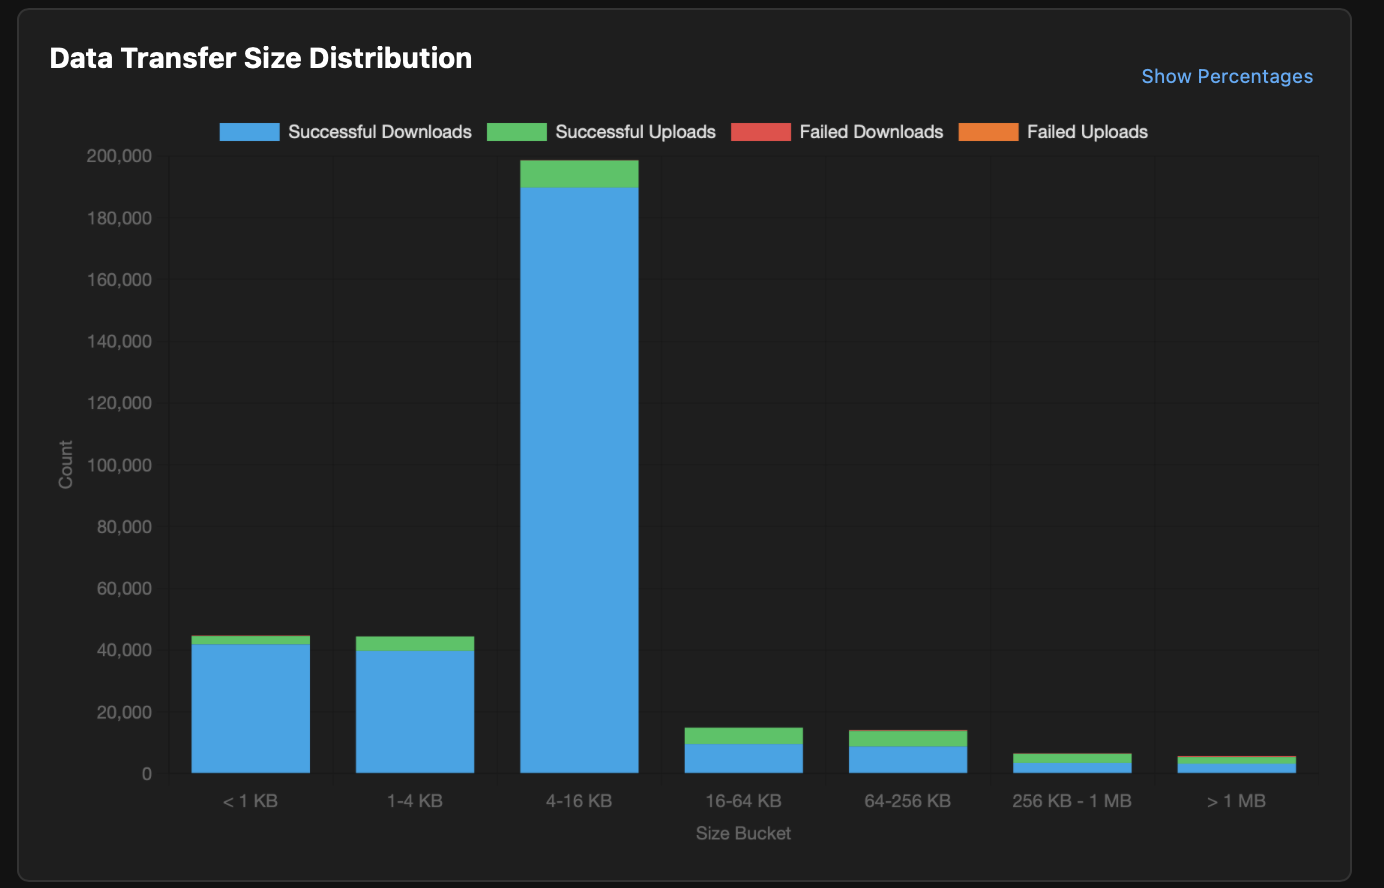
GET requests with 256byte size and offsets daily: 120k-180k
Top 5 pieces downloded 256byte with offsets: 6-52k
It’s a paid egress traffic, so I do not know why it should be matter. Unlikely the customer would explain what they are doing.
It causes a minimum of 128K read to my file system, also there is an overhead of much more than 256B unpaid traffic. Basically it spams my internet connection and makes me loosing races for more profitable data. Sorry but I would rather not have such downloads.
What is more profitable than operating a Storj Node?
Business would be easy if not for those pesky customers, right?
Last time I checked, these downloads are hitting a very small number of pieces, and were either quickly reading consecutive chunks of 256, or even hitting exactly the same site. So, after the first of these chunks, your OS would likely cache that page.
Standing on my head isn’t far behind. What are you trying to say here?
Hey, what spits out that handy graph for ya?
It’s a paid traffic since it’s GET. Why do you think that’s not paid?
Maybe you confuse it with PUT? PUT is not paid, but paid as a storage. So this way or another almost all usage is paid except the trash.
I mean the huge overhead coming with such small downloads. For today my nodes showing a combined egress of 200 GB while the router is showing 1 TB, so it’s actually 80% unpaid traffic from my point of view.
Did you isolate a storagenodes traffic from any other?
Also does it correlate with a payout history?
I mean the current estimation for the current month at its end with the actual usage in the paycheck for the same period? And how is it related to upstream usage on your router?