unfortunately, no - I haven’t used ai for extensive coding (relying on my own brain more).
But I am using chatgpt more and more (plus version with extended thinking). But I find it still over-engineers stuff if you don’t watch it closely
unfortunately, no - I haven’t used ai for extensive coding (relying on my own brain more).
But I am using chatgpt more and more (plus version with extended thinking). But I find it still over-engineers stuff if you don’t watch it closely
Definitely agree; for this toy the farthest I go is roocode architect stuff and then implement step by step.
This keep happening. I don’t even wait - as soon as I see it incorrectly imagined what I had in mind, but did not put in writing — I put it in writing. Ultimately, all my fault, but eventually intuition develops to know how to get what you want.
It’s not mean to replace the brain. On the contrary, it’s job to absolve you from the menial, so the brain can be more productive doing what matters most. — definitely not writing unit tests for a feature, or scrolling through pages of specifications when you need to find an answer on a very specific question. The key to productivity boost is that it’s much faster to verify correctness that to produce from scratch.
If machine can some some job — I don’t want to do that job. That would be wasting my brain power.
It’s a tool. If you don’t watch chainsaw closely also nothing good result. But also prompt engineering is a whole discipline now.
Agreed that it is, but the point I really meant to make is I force myself to do it manually more so that I can properly analyze what the ai is doing - to watch it closely for a good result, I need to be good at the underlying skill - and as my whole job is that skill, I strive to keep it sharp.
I’m not trying to come from a pretentious angle of not using tools cause it’s lesser (they are damn good overall tbh), just trying to not dull my own skill set (writing/reading/debugging code).
But yeah, in for your use case and question for recommendations, that’s why I don’t have a good one ![]()
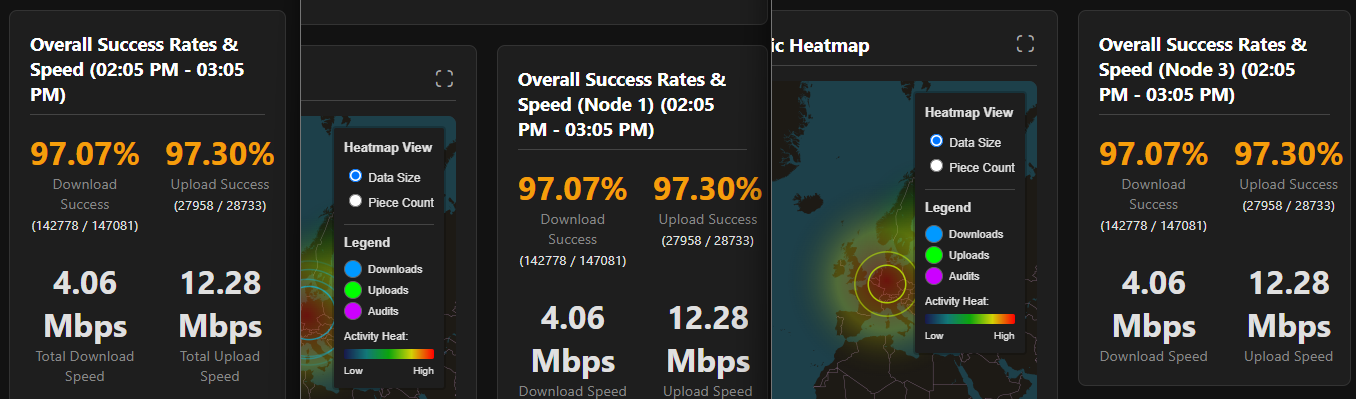
(sorry if it’s known problem): After several hours monitor stops updating some values (e.g., Overall Success Rates & Speed, Node Health & History). Other (like Live Performance or Heatmap) are running. When I select 24h in Live Performance, I see data for whole 24h. When I connect to https://nodes.arrogantrabbit.com/ I see similar situation (for example now it’s 4:17 PM):
Overall Success Rates & Speed (Node 1) (08:37 PM - 09:37 PM)
Overall Success Rates & Speed (Node 2) (03:17 PM - 04:17 PM)
Overall Success Rates & Speed (Node 3) (03:11 PM - 04:11 PM)
I did not found other way how to make it running again than restarting service itself. Funny enough - data are collected all the time as after restart, I see ‘previously missing’ hours in Node Health & History)
I checked service log - I don’t see anything suspicious there.
Have you the newest version? If you use the main branch, then there is already a fix released for that. (I think the single node dashboard uses the version without that patch)
And the monstroucity branch dashboard has this fixed too (I think. At least I didn’t encounter it there)
Edit: aah no I see, something must have broken there. Sorry. I can try to help him out there, if sir rabbit is not faster then me
Yah, I’m checking if there are new commits every GMT+1 morning ![]() (and usually there is) and update to latest version immediatelly. Today morning I found that
(and usually there is) and update to latest version immediatelly. Today morning I found that monstrosity was merged into main, so I switched back to main.
And on-purpose I checked as well on rabbit’s site to eliminate (at least partially) problem on my end. BTW: if it’s of any use, I’m public as well here
Edit: Sudenly (magic, no restart) on of nodes and aggregate work again, 2nd node is still at 10:35 AM
not reachable for me ![]()
Also @arrogantrabbit , if you are still taking requests - I would love to have data (even daily) of my storage in a node (used and deletion). Basically being able to see over time how the deletion grows/shrinks and same for stored data
Yes there is a problem with the event loop, that tracks new events and updates the stats then. I opened a pull request as draft, because I am monitoring it. You can do for testing and own risk update task.py manuell (or chief rabbit accepts it immediately if he want and can. Idk what GitHub allowed there)
Big tip: don’t try and code on mobile. That was a horrible experience that I cannot recommend. Not even if you hate yourself ![]()
Edit 2: wow, is the network sleeping at the moment? Haven’t seen such low speeds for a long time :o
I reverted three commits including that fix to merge monstrocity and forgot to cherry pick them back. fixed now.
Thank you for awesome bug reports – keep them coming! ![]()
Ahh, if that is the case I can close my pull request. I thought there were new changes and let ChatGPT recode that part. ![]()
Good thing is, I am learning new things about GitHub with every new day here ![]()
Don’t close it yet. Lets watch both. Yours looks cleaner, I’ll backout Sonnet’s fix and merge yours. Lets wait a few hours.
Sorry, some 20 minutes after this post electricity went down at our street. Just started now, should be accessible. I hope my nodes survived (I have no UPS)
Hehe, I know this pain. I pulled and installed main just now. Thank you (and Marvi) for your effort!
Beautiful dashboard. Thank you for this good looking and nice functional dashboard.
Thank only arrogantrabbit, I did nothing ![]() He did all the work for that beautiful Dashboard.
He did all the work for that beautiful Dashboard.
I just want to help a little bit without standing in the way. And learn how to use GitHub like a Pro ![]()
Ps: That dashboard should get the default dashboard at some point as it provides way more information ![]()
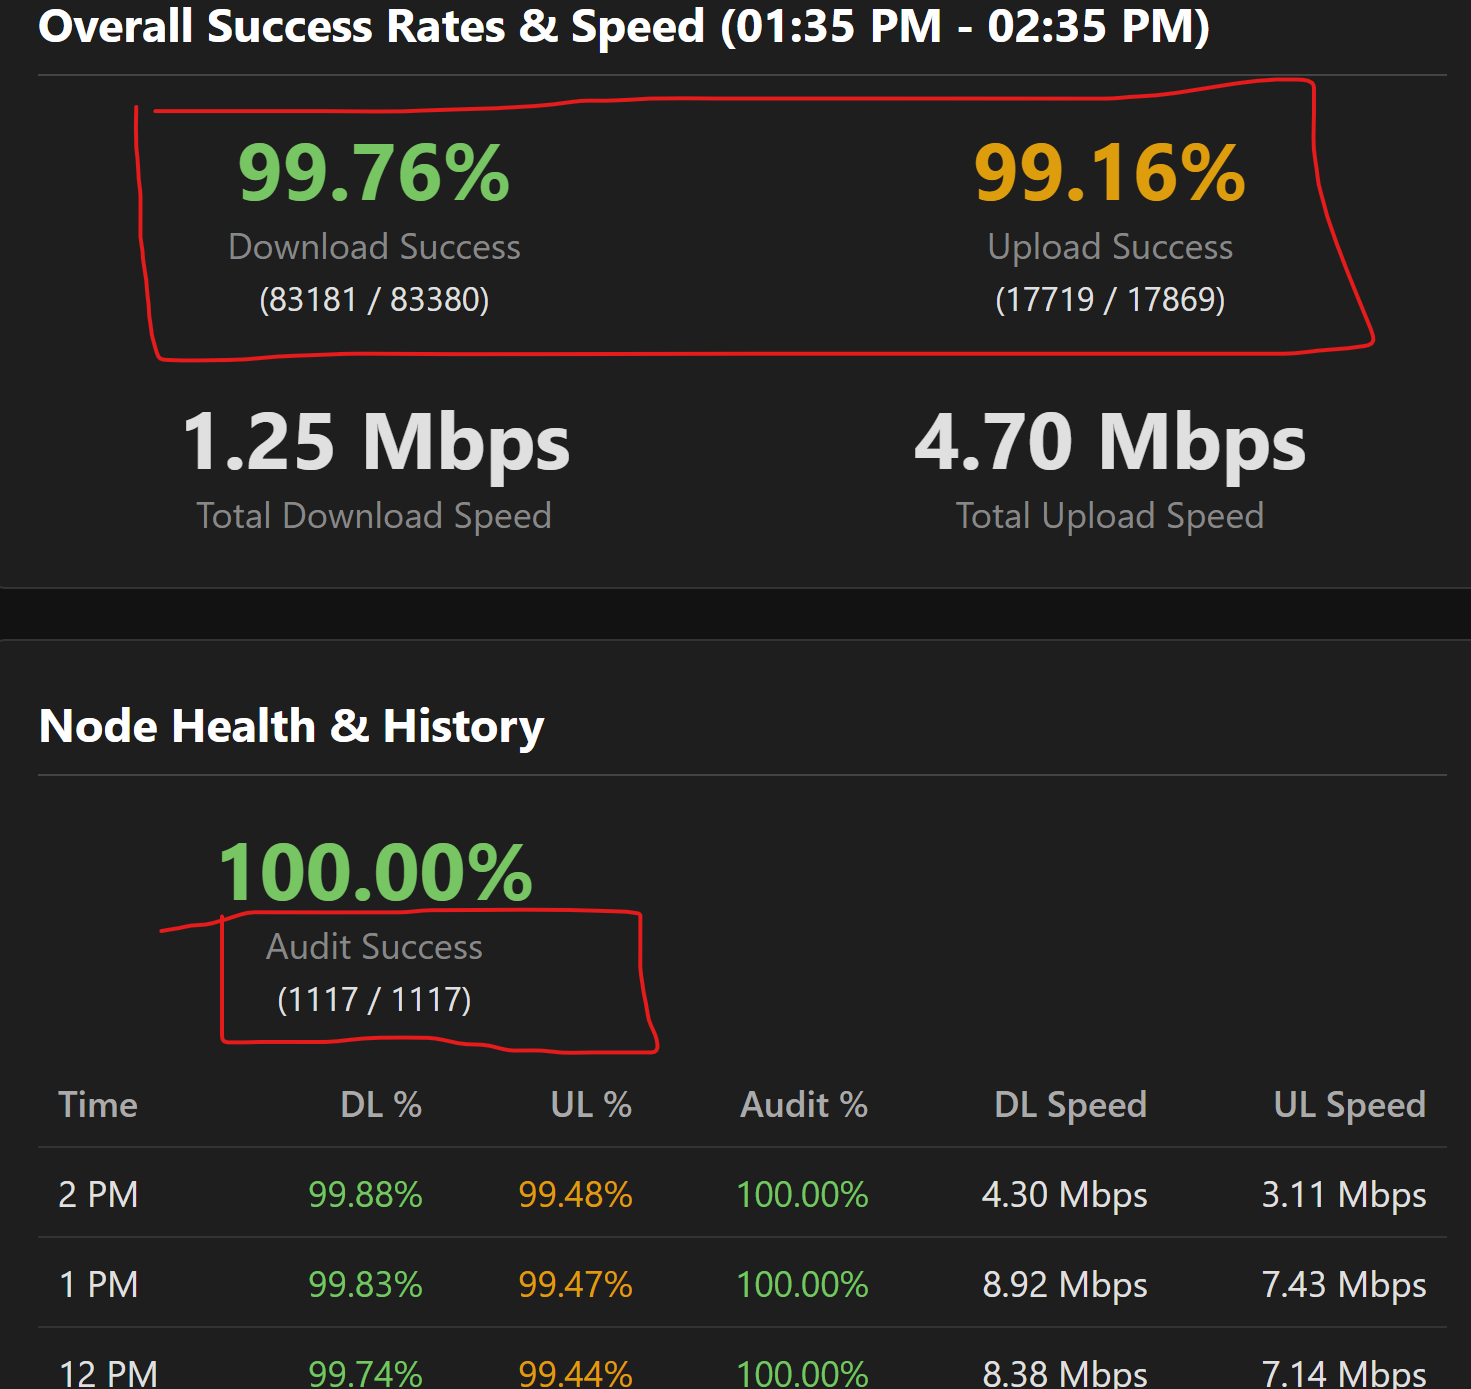
I’m running version from yesterday’s evening and monitor is basically updating, but red-marked values are stuck for several hours:
Edit: I see in github that you are very active today, arrogantrabbit. So sorry if I report fixed issue. I’ll update tommorow morning.
Hello, can you try if this fixes your problem?
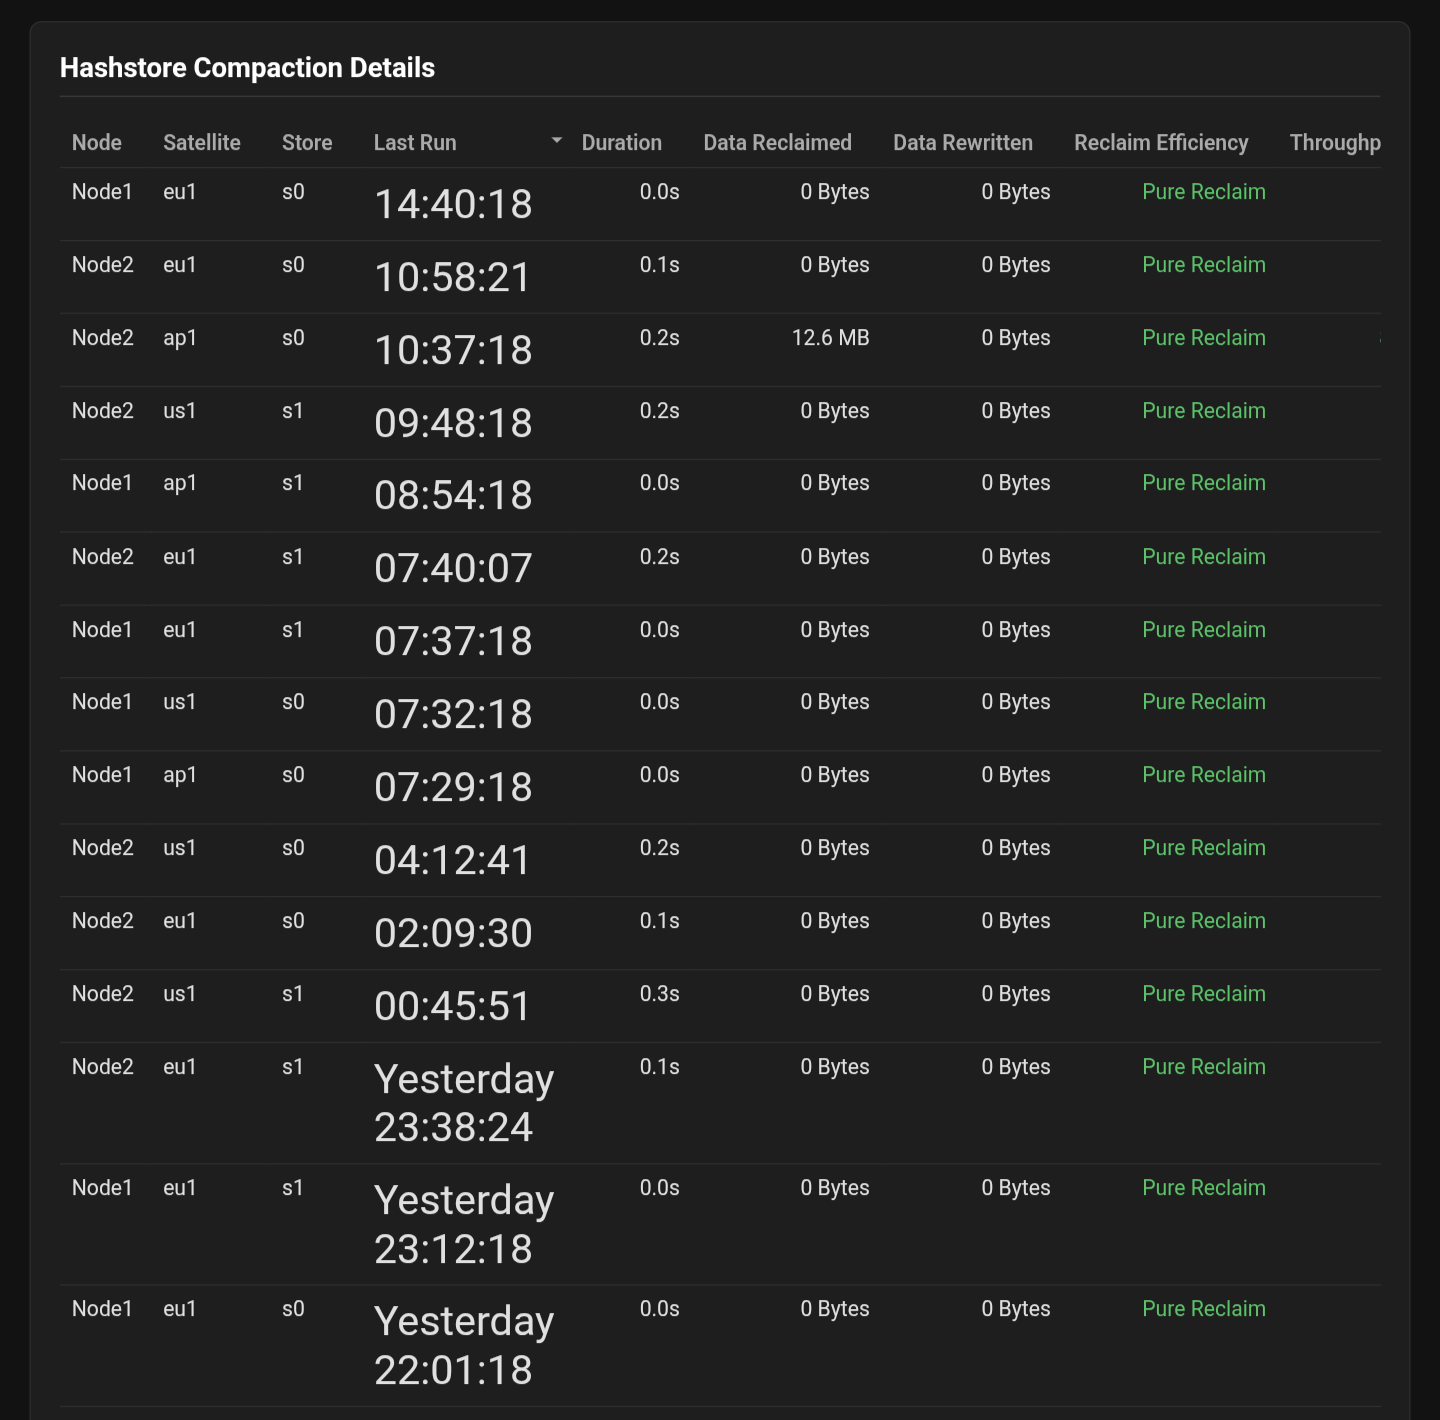
I saw some other things on your dashboard that got my attention. You have almost all compactions with 0s:
Do your logs report the same? Because that does not look normal to me. (Or do you know why almost all is reported as 0?)
I feel a bit like a troublemaker, but I found another issue now:
I’ll install changes tomorrow morning and report later on…
I didn’t check logs (yet), but I think it could be correct. I started passive migration just on one node and just yesterday. ~130GB in hashstore, nothing to write home about ![]()
I changed the request from draft to pull, will see if boss will accept it ![]()
Ok, then it makes sense, if there is nothing to compact that it is 0