With all these auditing, ranking, assigning you a reputation and disqualifying performed by satellites against nodes I wonder who audits and disqualifies the satellites when for ex., those don’t send bloom filters timely? I know, rhetorical question.
You joined on June 11, 2024. You will pass this phase too.
I guess I will take that risk if the ‘new normal’ comes true. In worst case there could be like 50% trash.
The facts are
- Storj audits, rates and disqualifies the nodes when those don’t comply to service level requirements.
- Nodes have no way of auditing, rating and disqualifying Storj’s systems.
- Storj doesn’t take responsibility for the bugs in its software and makes the nodes take that responsibility.
Conclusions:
- Storj doesn’t treat nodes as equal partners, it treats it as something lower in the hierarchy.
- Storj doesn’t take responsibility for its failures while demanding the nodes to take responsibility for their own failures and for Storj’s falures too.
Is this a context that leads to trust? I doubt so.
Did you have a “database is locked” errors in your logs? Because if yes, the collected stat would be wiped on restart (I also suspect that it wipe it in case of this error right away).
Hello @Dhend,
Welcome to the forum!
Yes, US1 and SLC satellites have gaps in the provided reports. Our engineers would backfill it, but it’s a low priority, since it doesn’t affect payouts or billing, sorry.
Falling dramatically again… ![]()
Yes, latest occurred on 12th
$ cat '/mnt/c/Program Files/Storj/Storage Node/storagenode.log' | grep locked
2024-06-10T17:37:11+04:00       ERROR   orders  failed to add bandwidth usage   {"satellite ID": "121RTSDpyNZVcEU84Ticf2L1ntiuUimbWgfATz21tuvgk3vzoA6", "action": "PUT", "amount": 6159360, "error": "bandwidthdb: database is locked", "errorVerbose": "bandwidthdb: database is locked\n\tstorj.io/storj/storagenode/storagenodedb.(*bandwidthDB).Add:76\n\tstorj.io/storj/storagenode/orders.(*Service).SendOrders.func2:249\n\tgolang.org/x/sync/errgroup.(*Group).Go.func1:78"}
2024-06-10T18:39:59+04:00       ERROR   piecestore      upload failed   {"Piece ID": "3TDJJMHJLIC4D4WE7EOGMC5VOKYYYNZMJ6JFES7XTFQNZIJR7GUA", "Satellite ID": "1wFTAgs9DP5RSnCqKV1eLf6N9wtk4EAtmN5DpSxcs8EjT69tGE", "Action": "PUT", "Remote Address": "79.127.205.240:42604", "Size": 249856, "error": "pieceexpirationdb: database is locked", "errorVerbose": "pieceexpirationdb: database is locked\n\tstorj.io/storj/storagenode/storagenodedb.(*pieceExpirationDB).SetExpiration:111\n\tstorj.io/storj/storagenode/pieces.(*Store).SetExpiration:584\n\tstorj.io/storj/storagenode/piecestore.(*Endpoint).Upload.func6:486\n\tstorj.io/storj/storagenode/piecestore.(*Endpoint).Upload:544\n\tstorj.io/common/pb.DRPCPiecestoreDescription.Method.func1:294\n\tstorj.io/drpc/drpcmux.(*Mux).HandleRPC:33\n\tstorj.io/common/rpc/rpctracing.(*Handler).HandleRPC:61\n\tstorj.io/common/experiment.(*Handler).HandleRPC:42\n\tstorj.io/drpc/drpcserver.(*Server).handleRPC:167\n\tstorj.io/drpc/drpcserver.(*Server).ServeOne:109\n\tstorj.io/drpc/drpcserver.(*Server).Serve.func2:157\n\tstorj.io/drpc/drpcctx.(*Tracker).track:35"}
2024-06-11T20:27:24+04:00       ERROR   piecestore      upload failed   {"Piece ID": "ECHDNYSQO434NHLHRY6NRLAP23DBCMZCLQBLFGMSRBHGQRNXZJGQ", "Satellite ID": "1wFTAgs9DP5RSnCqKV1eLf6N9wtk4EAtmN5DpSxcs8EjT69tGE", "Action": "PUT", "Remote Address": "79.127.205.243:60236", "Size": 249856, "error": "pieceexpirationdb: database is locked", "errorVerbose": "pieceexpirationdb: database is locked\n\tstorj.io/storj/storagenode/storagenodedb.(*pieceExpirationDB).SetExpiration:111\n\tstorj.io/storj/storagenode/pieces.(*Store).SetExpiration:584\n\tstorj.io/storj/storagenode/piecestore.(*Endpoint).Upload.func6:486\n\tstorj.io/storj/storagenode/piecestore.(*Endpoint).Upload:544\n\tstorj.io/common/pb.DRPCPiecestoreDescription.Method.func1:294\n\tstorj.io/drpc/drpcmux.(*Mux).HandleRPC:33\n\tstorj.io/common/rpc/rpctracing.(*Handler).HandleRPC:61\n\tstorj.io/common/experiment.(*Handler).HandleRPC:42\n\tstorj.io/drpc/drpcserver.(*Server).handleRPC:167\n\tstorj.io/drpc/drpcserver.(*Server).ServeOne:109\n\tstorj.io/drpc/drpcserver.(*Server).Serve.func2:157\n\tstorj.io/drpc/drpcctx.(*Tracker).track:35"}
2024-06-12T05:16:27+04:00       ERROR   piecestore      upload failed   {"Piece ID": "TCHMUMYEHONNU4AKHBAID6NWYRICEMXZJPKV3IQRTEKYFWMSJ46A", "Satellite ID": "1wFTAgs9DP5RSnCqKV1eLf6N9wtk4EAtmN5DpSxcs8EjT69tGE", "Action": "PUT", "Remote Address": "79.127.205.240:60750", "Size": 3328, "error": "pieceexpirationdb: database is locked", "errorVerbose": "pieceexpirationdb: database is locked\n\tstorj.io/storj/storagenode/storagenodedb.(*pieceExpirationDB).SetExpiration:111\n\tstorj.io/storj/storagenode/pieces.(*Store).SetExpiration:584\n\tstorj.io/storj/storagenode/piecestore.(*Endpoint).Upload.func6:486\n\tstorj.io/storj/storagenode/piecestore.(*Endpoint).Upload:519\n\tstorj.io/common/pb.DRPCPiecestoreDescription.Method.func1:294\n\tstorj.io/drpc/drpcmux.(*Mux).HandleRPC:33\n\tstorj.io/common/rpc/rpctracing.(*Handler).HandleRPC:61\n\tstorj.io/common/experiment.(*Handler).HandleRPC:42\n\tstorj.io/drpc/drpcserver.(*Server).handleRPC:167\n\tstorj.io/drpc/drpcserver.(*Server).ServeOne:109\n\tstorj.io/drpc/drpcserver.(*Server).Serve.func2:157\n\tstorj.io/drpc/drpcctx.(*Tracker).track:35"}
So how to fix it?
The test data obviously comes with significantly reduced expansion factor. So storj actually has to pay SNOs less per customer data TB. If this becomes the new normal they could easiely use a small part of that extra cash to compensate SNOs for trash.
Does it? Only around 11k subnets were active, and only around 1k wallets were paid according to storjnet.info.
This has been a hot topic on the forums for the last 3 months. I think most regulars assumed everyone knew the root cause.
We do lack a clear communication channel for these types of information. This was a recent attempt to remedy the problem, but apparently the thread is already dead. (btw, why was this thread not pinned?)
At the moment only by moving databases to a different disk with less load, preferable - to SSD:
HI
I did raise this in another thread a week or so ago - and was sent this way. Long story short, same issue, dash not matching earnings script, lots of uncollected garbage, trash, no paying data and now I have a full node.
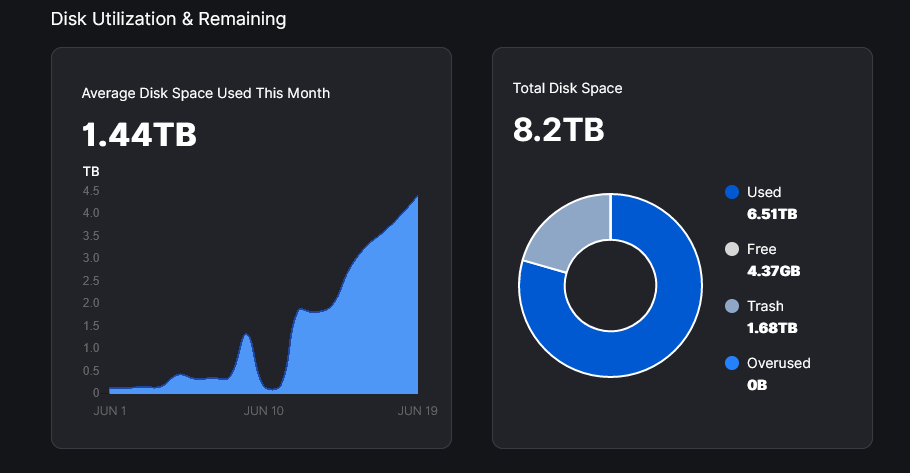
Of my 8.2TB node, 4TB or 50% is uncollected garbage/trash and unpaid - that was not really what I signed up to - but if its a short term glitch you are working on then fine. I have been restarting the node to force the used file walker - all complete without errors as advised in the other thread.
I appreciate many others are reporting similar behavior - do we wait? Is there a plan?
For me this was an initial test - I have another 30TB I could bring online - but if its simply filling with unpaid trash, I wont rush to make any changes.
Thanks
CC
When the 1.104 upgrade went in for me, all my trash got cleaned up over a few days. But I had never altered any filewalker defaults. You could check if there’s any old 2-letter trash folders that were missed and delete them manually.
Thanks @Roxor - my node went live a few months ago with v1.104.5 - so no version upgrade for me as yet. It was running normally, gradual incrementing storage - until the testing started.
If this was all real paying data then I have no issue how StorJ wish to use the storage - but pretty sure this is not the case.
See this thread: Filewalker not running when disabling lazyfilewalker - #16 by flwstern
Hopefully littleskunk will prioritize ![]()
@flwstern Thank you - I had not seen that thread, its a little hostile over there! It does look like there are some bugs in play, I will look out for a new release, in teh mean time I will force another restart to trigger the filewalker - although all these restarts have had an impact on my availability.
Thanks
CC
Nothing to worry about always like that when talking to some people from storj ![]()
Maybe their busines model doesn’t need SNO’s … ![]()
Errr… where are you getting those numbers from?
That graph you showed seems to indicate about 1.5TB of trash and 6.5TB (ish) used?
Good question - using the earning calc script which identifies additional uncollected garbage.
Node            Storage   Disk Current Total    -not paid-             8.20 TB
Node            Storage              ├ Blobs    -not paid-             6.44 TB
Node            Storage              └ Trash  ┐ -not paid-             1.75 TB
Node+Sat. Calc. Storage   Uncollected Garbage ┤ -not paid-             2.24 TB
Node+Sat. Calc. Storage   Total Unpaid Data <─┘ -not paid-             3.99 TB
CC