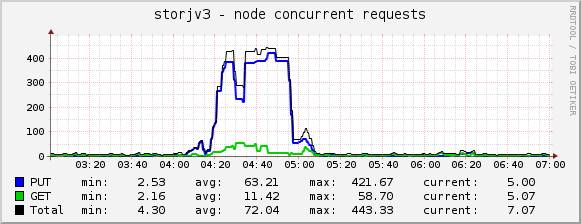
I noticed some weirdness, mainly this (time is GMT+3):
This may not be accurate as there are limits on how far back in the log my script looks.
This seems to be mainly from “us1” satellite:
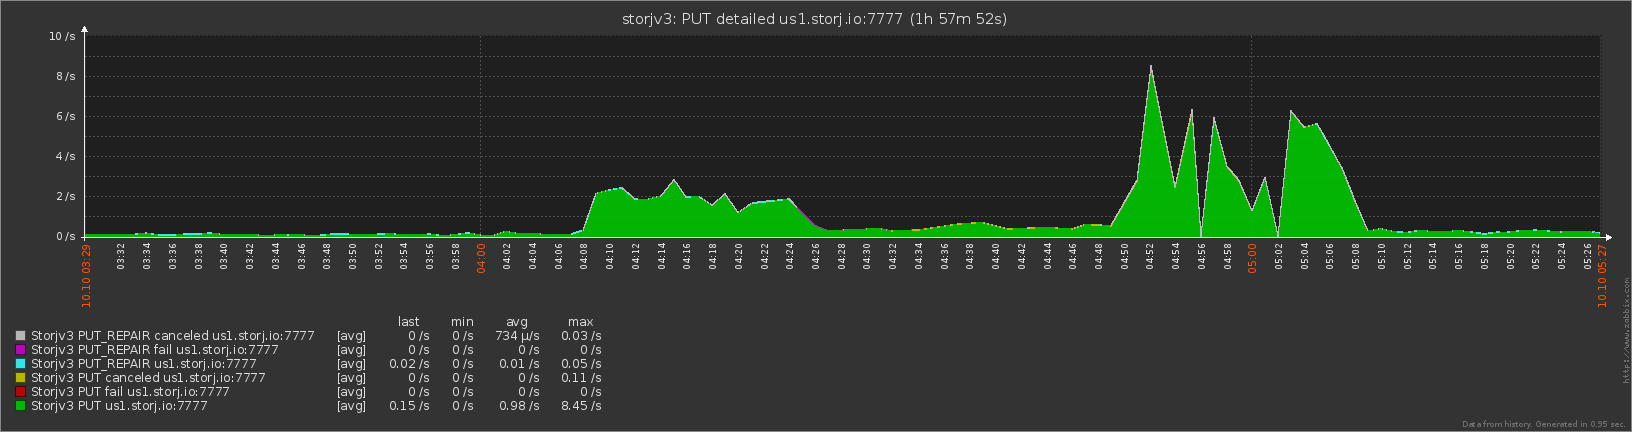
Over two hour period, there were ~6200 successful uploads with an average size of ~50kB, with the smallest being 512B and largest ~2MB.
File size distribution over those two hours on that satellite (the count shows how many files were uploaded that are smaller than the “size”, but larger than previous “size”):
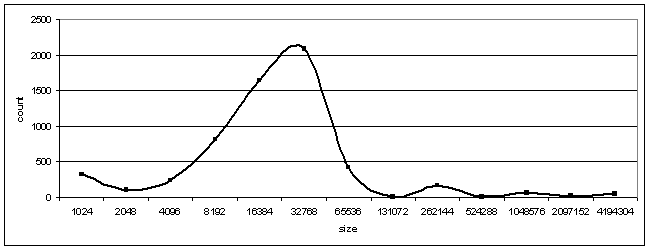
Assuming the uploads get distributed to all nodes about equally (and not just to my node), somebody was doing about 84000 uploads of small files per second to the network. Interesting, though I wonder if it would’t be better to use Storj for larger files. I’m pretty sure uploading and downloading lots of tiny files has to be slower just because of the latency (and it looked like my node took a long time for some of them. For example:
2021-10-10T01:39:59.738Z        INFO    piecestore      upload started  {"Piece ID": "SY2IYYFQROIRUONE3J7VGMZZSLHNG42RMTX6542QV6WGAKPEIAEA", "Satellite ID": "12EayRS2V1kEsWESU9QMRseFhdxYxKicsiFmxrsLZHeLUtdps3S", "Action": "PUT", "Available Space": 1095551565824}
2021-10-10T01:54:15.050Z        INFO    piecestore      uploaded        {"Piece ID": "SY2IYYFQROIRUONE3J7VGMZZSLHNG42RMTX6542QV6WGAKPEIAEA", "Satellite ID": "12EayRS2V1kEsWESU9QMRseFhdxYxKicsiFmxrsLZHeLUtdps3S", "Action": "PUT", "Size": 5120}
14 minutes for 5kB and it was successful!
Load graph for my node looks interestign as well -

I guess I should get those nvme SSDs for SLOG…