
Then maybe I’m vetted after all.
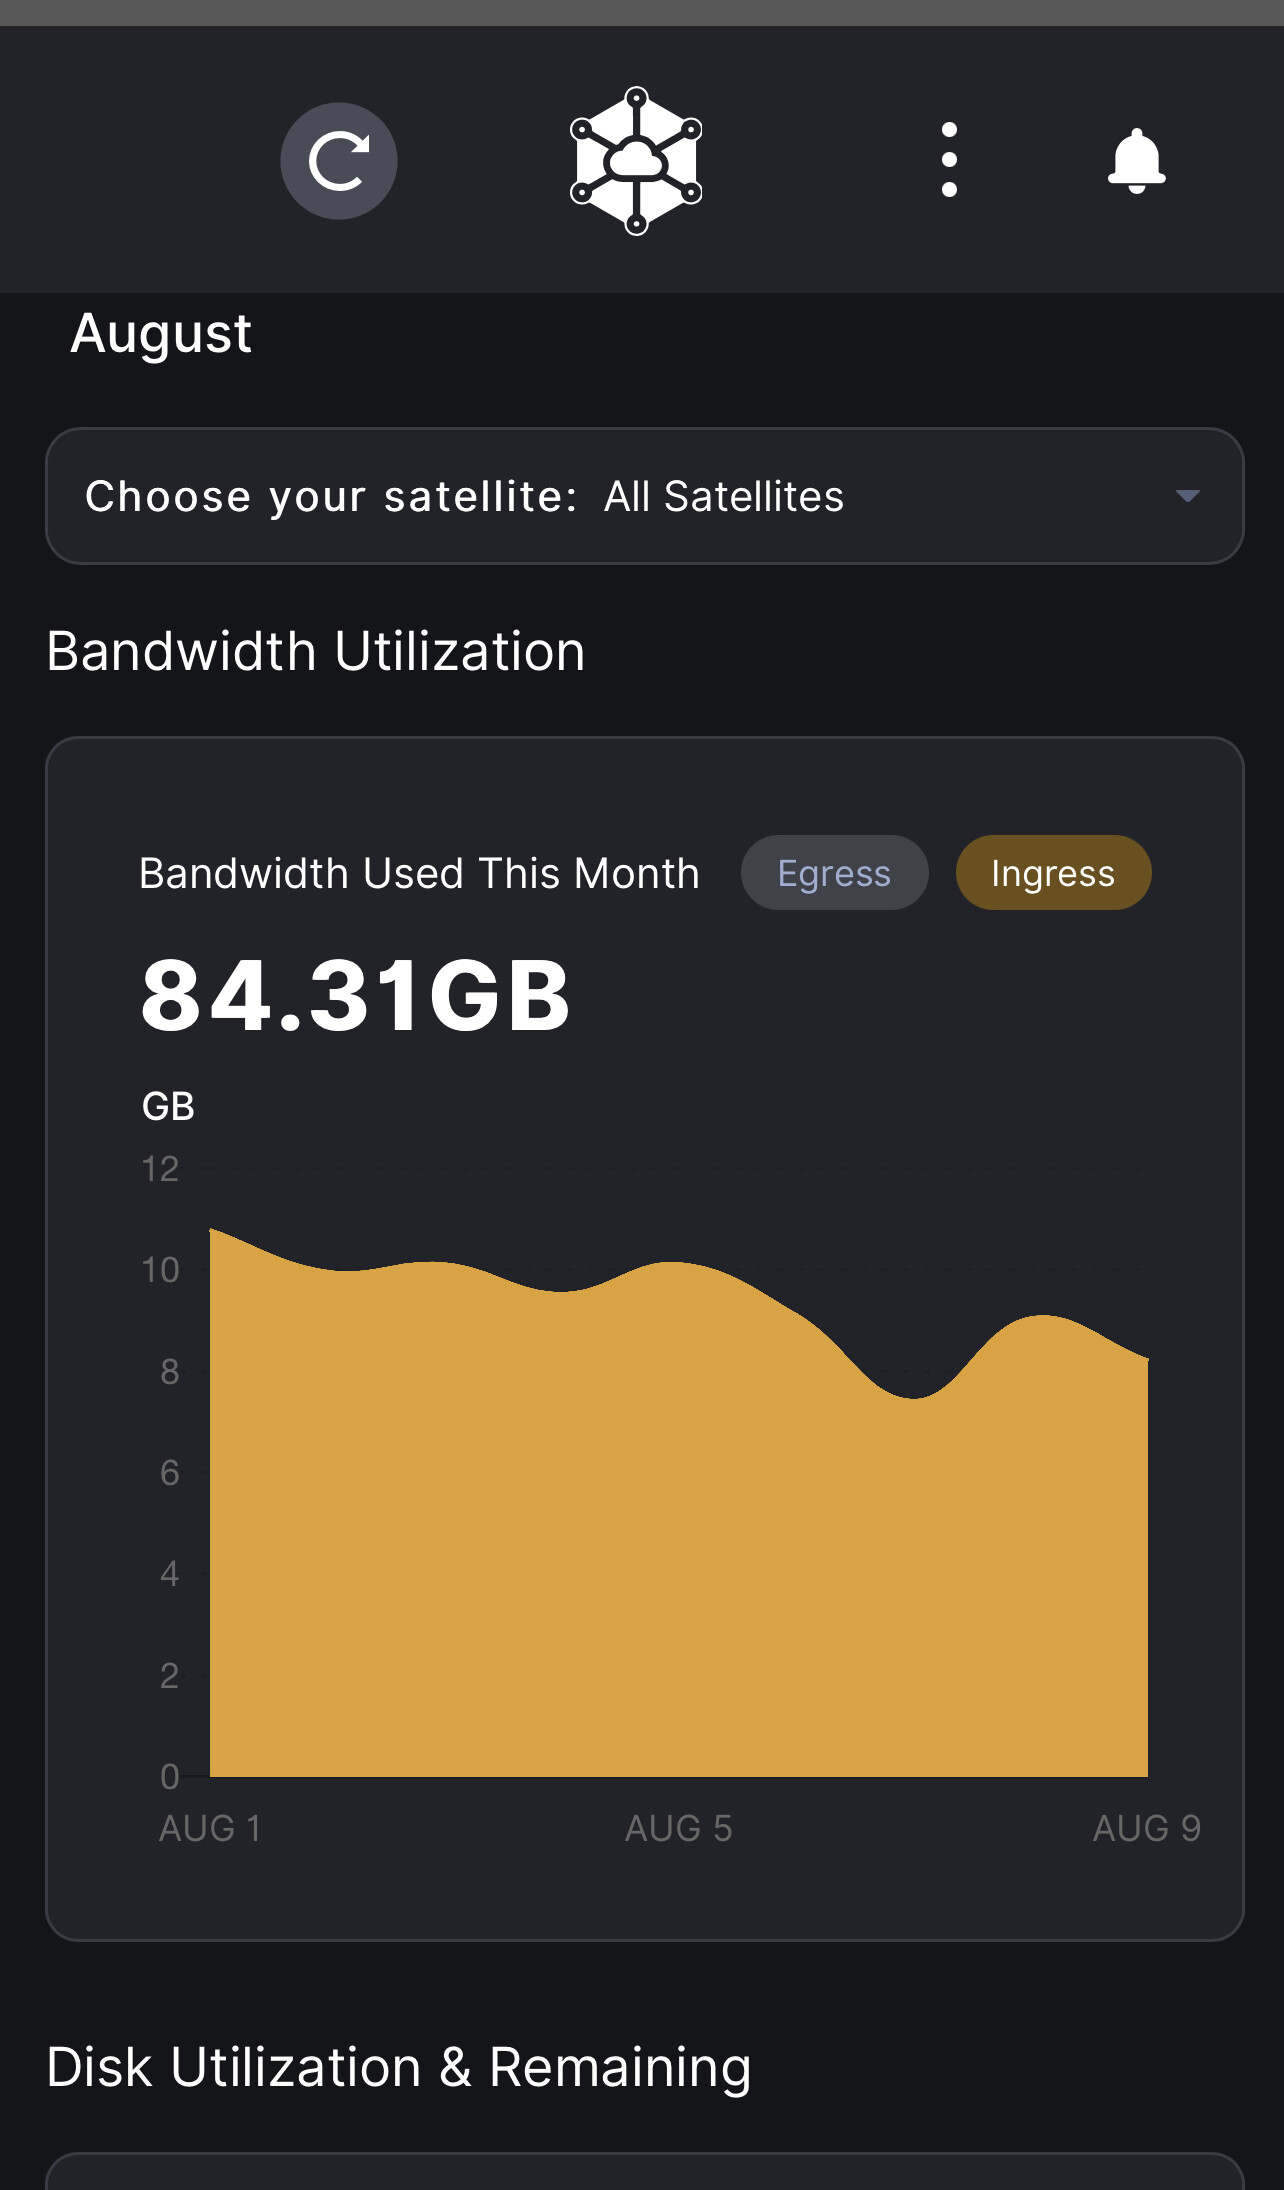
Can you share just ingress (my total is 169GB on an 8.5 month node)
your ingress looks fine.
easiest is to look at daily, since the totals are transitory.
is your node in only one in subnet?
EUNorth1 took me 7 months to be vetted on and as of today I have 34GB Ingress on that satellite. Today my total ingress is 121GB, -34GB for EUNorth1 = 87GB which aligns near your Ingress
I only have one node. Not sure if there are more nodes. Just happy to help 
You can try using this tool for checking your subnet. I know it doesn’t detect all my nodes, but it does put a lower bound on the known number.
2 Likes

looks pretty close to me
1 Like
oops, repost:
Just about the same with mine too. Thanks for this info. I migrated off a physical host to proxmox vm the middle of last month and this confirms i did a good job. Did you guys see data download (to customer) falling off a bit toward the end of the month?
there was a drop in egress, there was a forum post if you want some graphs
https://forum.storj.io/t/my-egress-has-dropped-significantly-over-the-past-few-days
1 Like
I noticed some weirdness, mainly this (time is GMT+3):
This may not be accurate as there are limits on how far back in the log my script looks.
This seems to be mainly from “us1” satellite:
Over two hour period, there were ~6200 successful uploads with an average size of ~50kB, with the smallest being 512B and largest ~2MB.
File size distribution over those two hours on that satellite (the count shows how many files were uploaded that are smaller than the “size”, but larger than previous “size”):
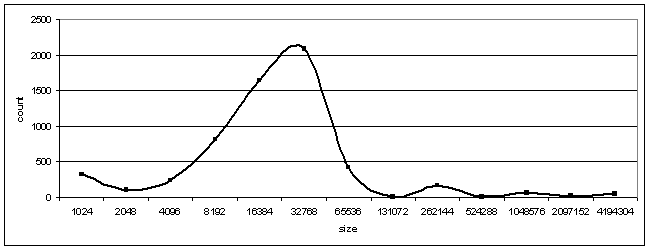
Assuming the uploads get distributed to all nodes about equally (and not just to my node), somebody was doing about 84000 uploads of small files per second to the network. Interesting, though I wonder if it would’t be better to use Storj for larger files. I’m pretty sure uploading and downloading lots of tiny files has to be slower just because of the latency (and it looked like my node took a long time for some of them. For example:
2021-10-10T01:39:59.738Z        INFO    piecestore      upload started  {"Piece ID": "SY2IYYFQROIRUONE3J7VGMZZSLHNG42RMTX6542QV6WGAKPEIAEA", "Satellite ID": "12EayRS2V1kEsWESU9QMRseFhdxYxKicsiFmxrsLZHeLUtdps3S", "Action": "PUT", "Available Space": 1095551565824}
2021-10-10T01:54:15.050Z        INFO    piecestore      uploaded        {"Piece ID": "SY2IYYFQROIRUONE3J7VGMZZSLHNG42RMTX6542QV6WGAKPEIAEA", "Satellite ID": "12EayRS2V1kEsWESU9QMRseFhdxYxKicsiFmxrsLZHeLUtdps3S", "Action": "PUT", "Size": 5120}
14 minutes for 5kB and it was successful!
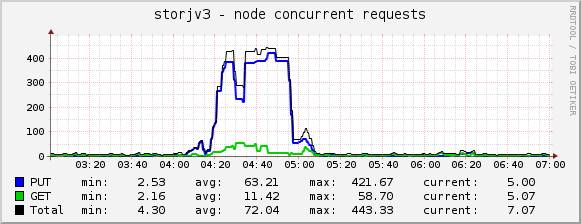
Load graph for my node looks interestign as well -

I guess I should get those nvme SSDs for SLOG…
2 Likes
i think files often start small and then grow… but not sure… just seems to behave like that from what little tracking i have of them.
but yeah the small files are killer
I think that the whole network (or at least a big part of it) was congested at the time. The reason is that my node took 14 minutes to service the upload of a 5kB file and did not “lose the race”.
During those two hours, my node had 10240 successful uploads and 111 canceled ones. Knowing that my node was overloaded and very slow, it stands to reason that most of other nodes were overloaded and very slow.
2 Likes
Could also just be a customer uploading tons of stuff in parallel and slowing down the connection on their end. If their upload is slow, you will also see pieces still finish successfully after a long time. It’s pretty hard to get the entire network congested, so I highly doubt that actually happened.
1 Like
been seeing some bandwidth peaks lately… much more than usual i think…
ofc its not exactly a straight line, but pretty sure this is new ish…
didn’t use to see minutes to hour long peaks of 4-5x normal ingress, in the past its often been very stable for long periods.
if i was to hazard a guess it’s real user interactions with the network, as what we have seen in the past was mostly test data or often test data.
have only really looked at the bandwidth usage, not sure how many files and such was accessed
If I understand how Storj works correctly, for every segment, the satellite provides a new set of nodes (some nodes may be offered more than once, but in general, the node selection process runs every time). So, if a customer wanted to upload 1000 files, he would get 1000 sets of nodes instead of getting one set and being told “put everything there”.
So, if my node got 8 uploads per second, then I would think that pretty much all nodes (with free space) got about 8 requests per second.
My node uses 7200 RPM drives in two raidz2 vdevs (one vdev is 6 drives). Raidz2 does not have great performance, but I would think the whole pool should be a bit faster than a single 5400RPM drive. So, if my node could not keep up, nodes that have single drives probably also could not keep up (I would say that load average over 400 is a bit too much). Nodes that have SSD SLOGs probably could keep up, but still, I think that a bit part of the network was slow, even for other customers.
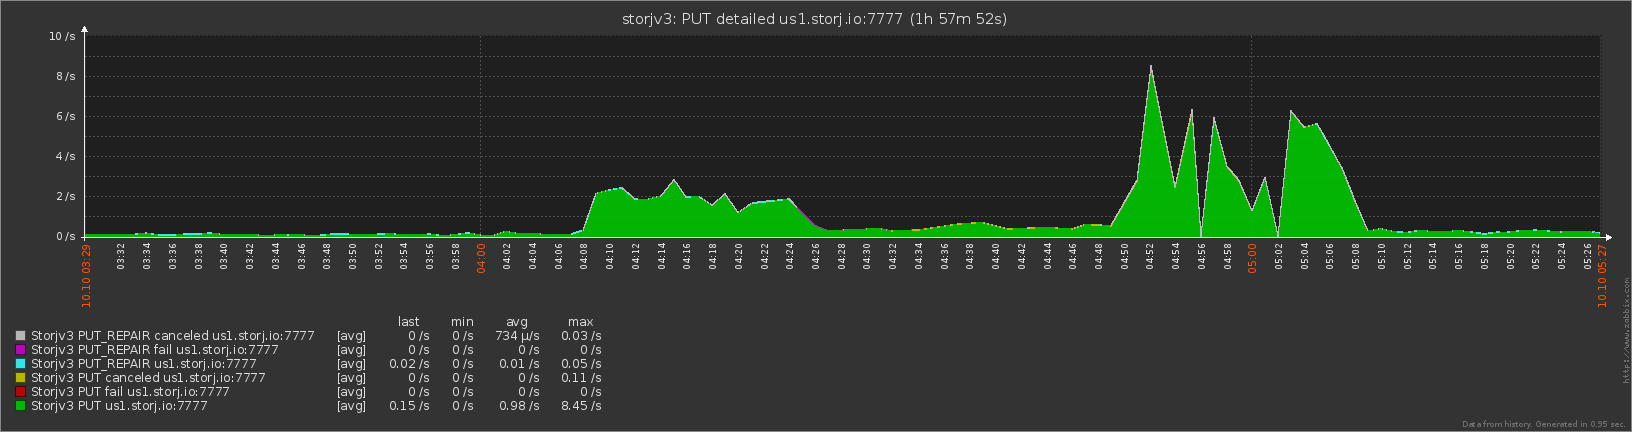
Another piece of evidence:
2021-10-10T01:30:25.115Z        INFO    piecestore      upload started  {"Piece ID": "CWQ4IE247MOGQ52N4QXGQF3FC6ML77XMNSFKUV3XUVCJPM2MLPMQ", "Satellite ID": "12L9ZFwhzVpuEKMUNUqkaTLGzwY9G24tbiigLiXpmZWKwmcNDDs", "Action": "PUT", "Available Space": 1095611457792}
2021-10-10T01:30:28.733Z        INFO    piecestore      upload started  {"Piece ID": "RIGBJ2UAGYXT4TT7S3OCMVWP7IQ7J7ECXXC773EBDOSITTJWFYLQ", "Satellite ID": "121RTSDpyNZVcEU84Ticf2L1ntiuUimbWgfATz21tuvgk3vzoA6", "Action": "PUT_REPAIR", "Available Space": 1095610385408}
2021-10-10T01:43:36.816Z        INFO    piecestore      uploaded        {"Piece ID": "CWQ4IE247MOGQ52N4QXGQF3FC6ML77XMNSFKUV3XUVCJPM2MLPMQ", "Satellite ID": "12L9ZFwhzVpuEKMUNUqkaTLGzwY9G24tbiigLiXpmZWKwmcNDDs", "Action": "PUT", "Size": 181504}
2021-10-10T01:50:24.751Z        INFO    piecestore      uploaded        {"Piece ID": "RIGBJ2UAGYXT4TT7S3OCMVWP7IQ7J7ECXXC773EBDOSITTJWFYLQ", "Satellite ID": "121RTSDpyNZVcEU84Ticf2L1ntiuUimbWgfATz21tuvgk3vzoA6", "Action": "PUT_REPAIR", "Size": 2560}
13 and 20 minutes for 181kB and 2kB pieces respectively. These were repair uploads from two different satellites. Either the sattelites were also overloaded or all quite a few nodes were overloaded so that my node did not “lose the race”.
Repair doesn’t do long tail cancellation as far as I know. So I don’t think that conclusion is correct. But yes that confirms that your node was overloaded. I don’t really see similar resource usage on my end, but I don’t log the specific piece info like you do.
Do you also have a Storj DCS account? If something like this occurs again, it might be interesting to test customer performance to verify whether there is an impact.
I’m seeing “upload canceled” on repair uploads:
2021-10-10T01:28:00.972Z        INFO    piecestore      upload started  {"Piece ID": "K5ATEYKI5HZ2BRRWNK7ZCMPCBGK32LQ7E3STGGX7FXZPXKDNZUYQ", "Satellite ID": "1wFTAgs9DP5RSnCqKV1eLf6N9wtk4EAtmN5DpSxcs8EjT69tGE", "Action": "PUT_REPAIR", "Available Space": 1095629692672}
2021-10-10T01:32:31.375Z        INFO    piecestore      upload canceled {"Piece ID": "K5ATEYKI5HZ2BRRWNK7ZCMPCBGK32LQ7E3STGGX7FXZPXKDNZUYQ", "Satellite ID": "1wFTAgs9DP5RSnCqKV1eLf6N9wtk4EAtmN5DpSxcs8EjT69tGE", "Action": "PUT_REPAIR", "Size": 1056768}
I think only repair downloads do not have cancellation (but they should time out after 5 minutes.
But I may be wrong, so let’s find some non-repair uploads 
2021-10-10T01:32:56.389Z        INFO    piecestore      upload started  {"Piece ID": "ZPZJV6MSVL4JNYJQKEJ6S3THEMZPA5PLAAJOQRFQEMWLXIID3YMA", "Satellite ID": "1wFTAgs9DP5RSnCqKV1eLf6N9wtk4EAtmN5DpSxcs8EjT69tGE", "Action": "PUT", "Available Space": 1095590403840}
2021-10-10T01:38:14.144Z        INFO    piecestore      upload started  {"Piece ID": "VECIYORR5YDKWCRTBJ5ZEGKBKMDJX4WMRFAZNQSC4J52FUDB3SYQ", "Satellite ID": "121RTSDpyNZVcEU84Ticf2L1ntiuUimbWgfATz21tuvgk3vzoA6", "Action": "PUT", "Available Space": 1095558782976}
2021-10-10T01:39:46.589Z        INFO    piecestore      upload started  {"Piece ID": "V2PVZ5UJAQ3WQKYWGUQPCBIA4RWSUZ65QYYUMIDWAIGK77NB2KXA", "Satellite ID": "12L9ZFwhzVpuEKMUNUqkaTLGzwY9G24tbiigLiXpmZWKwmcNDDs", "Action": "PUT", "Available Space": 1095551719936}
2021-10-10T01:51:21.114Z        INFO    piecestore      uploaded        {"Piece ID": "VECIYORR5YDKWCRTBJ5ZEGKBKMDJX4WMRFAZNQSC4J52FUDB3SYQ", "Satellite ID": "121RTSDpyNZVcEU84Ticf2L1ntiuUimbWgfATz21tuvgk3vzoA6", "Action": "PUT", "Size": 9472}
2021-10-10T01:51:23.663Z        INFO    piecestore      uploaded        {"Piece ID": "ZPZJV6MSVL4JNYJQKEJ6S3THEMZPA5PLAAJOQRFQEMWLXIID3YMA", "Satellite ID": "1wFTAgs9DP5RSnCqKV1eLf6N9wtk4EAtmN5DpSxcs8EjT69tGE", "Action": "PUT", "Size": 354560}
2021-10-10T01:55:28.991Z        INFO    piecestore      uploaded        {"Piece ID": "V2PVZ5UJAQ3WQKYWGUQPCBIA4RWSUZ65QYYUMIDWAIGK77NB2KXA", "Satellite ID": "12L9ZFwhzVpuEKMUNUqkaTLGzwY9G24tbiigLiXpmZWKwmcNDDs", "Action": "PUT", "Size": 1304832}
It is possible that the same customer who was uploading files using “us1” satellite also has accounts on three other satellites and was uploading using all accounts at the same time, but it could also be that these uploads were from other customers (or test data, in case of “saltlake” satellite 1wF)
My DCS account should still be active. Storj used to give some storage space and some bandwidth for free, do they still do that?
It may be interesting to measure the time it takes to upload and delete, say, a 1kB file, say, once every few minutes.