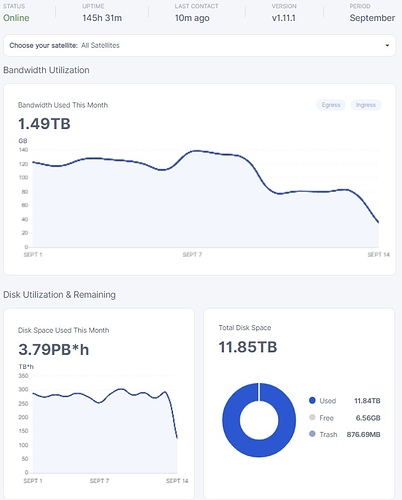
Well… since 30 minutes now I see giant ingress - 30 minutes 7 GB … maybe 15 GB per hour …
Maybe tests returned?
nice, I only get 25Mbps… Kinda sad you get twice that.
Oh wait, that is just your max… Well then ![]() I have 25Mbps ingress average at the moment. But your average will be more than just the last hour.
I have 25Mbps ingress average at the moment. But your average will be more than just the last hour.
I imagine it’s probably the same, our tools just measure diff? Mine takes a live snapshot of the interface speed at each interval, and points those out, grafana takes the avg (can’t remember my time config). This spike is actually averaging 32mbps, which is probably a little more accurate representation.
Probably yes. My grafana uses the node API and averages the last 5 or 10 minutes of data.
But the data just stopped lol… hopefully only shortly.
My average for one hour was also ~25Mbits
Unfortunately i think it’s over ![]()
my spikes were around 100Mbits (for 1 second intervals) but I am using darkstat
For a few minutes I had 140Mbps… Maybe it was a mistake when starting a new test. Guess we’ll find out if the ingress comes back.
Holy ingress Batman!
i really need to get my docker in a container with host disk access thing working…
so i can separate the proxmox storagenode bandwidth graph from the total bandwidth…
well it’s been a long time since real ingress… so i suspect we are going to get hammered soon…
the ingress is usually instable at first, when its ramping up the test data, because the transmission nodes / satellites or whatever they are supposedly run cycles, so now some of them are done doing their previous work and has moved on to doing ingress test data.
but until the entire fleet or whatever is completely finished it will be a bit random…
wonder if it isn’t a good time to run a scrub… been about 14 days for me… monthly scrubs are a bit to long for me to trust my hardware that long…
you making things to complecated, just get normal router like miktorik, you can monitor trafic on every ip/port and get grafs.
If you need just some “short term” traffic monitoring you can install darkstat -its really fun to configure, easy to access through http and lightweight, only downfall - its not in active development ![]() since few years now.
since few years now.
And has stupid graphs visualisations lol… tried to grab his xml data and visualise it through different js script… but can’t find those files on my hdd…
the plan in the routing department is to install pfsense, which is essentially one of the top tier enterprise router OS’s
my router may be able to do what you state, it’s a very good router… has 10gbit and maybe fiber… not sure what each box does… most likely there is a fiber modem type thing and then a router …
i plan on using pfsense because i got multiple subnets i want to coordinate…
so most normal routers will not be up for the task… i think… been a long time since i was dealing with routers much… so my knowledge is well outdated.
pfsence is realy good router, if you google a litle you will be able to get all neded.
How did you extract this number precisely? I would love to track my nodes performance. Ty in advance
You can get egress, ingress, used space by writing down values from your dashboard.
http://localhost:14002
(if you didn’t change any initial values)
You can get it also from API - search for storage API in search box - there is a topic about curl and jd queries.
Other values are derivatives from those values.
If you want, i can post my calculation formulas.


