Those spikes might be the controller or motor kinda glitching out- I’d call up WD/Seagate/HGST/Toshiba and see if I can’t get a replacement.
And yea, at 90-95% the air is basically wet. I’d be worried about any dust saturating and conducting.
Those spikes might be the controller or motor kinda glitching out- I’d call up WD/Seagate/HGST/Toshiba and see if I can’t get a replacement.
And yea, at 90-95% the air is basically wet. I’d be worried about any dust saturating and conducting.
i know they are working on migration, but after taking care of this thing for months, i cannot help but feel bad looking at that… even if its not real
@kalloritis
well the disk is running amazing for now, it’s latency dropped by a factor of 7 - 10 and it was already fairly okay to begin with… which kinda makes me wonder how many other drives might be affected by this… just to a much lesser degree
its latency seems almost lower than all the others… so it went from being the highest to the lowest… and i really thought it was broken… but i guess it was leaking current making it loose power for a few miliseconds, nothing really dangerous about that aside from creating instability i think…
but yeah dust is and issue and humidity i’m sure doesn’t help with that, but thus far the server itself have seen no issues with that, and i have seen other servers in similar environment being basically full of dust without issues… aside from ofc
so not sure that’s really an issue… the real issue in high humidity is corrosion… thus far i’ve had to replace fans because their cables corroded through and vibrated them to pieces, most of my caddies are showing rust marks… considered giving them some WD40 but was worried it would be conductive and just make the real issue worse also oil and computers are not the best combo…
90% becomes 60% if you add 4 degrees C
not sure my humidity measurement thing is accurate… and also tried running a dehumidifier 24/7 but the water just seems to get replaced from one or more of many options…
but it does seem like the room is dropping in humidity over time… even if it’s a very slow process, but then again i also did a lot of concrete work so there maybe still leaking humidity out from that for some amount of time…
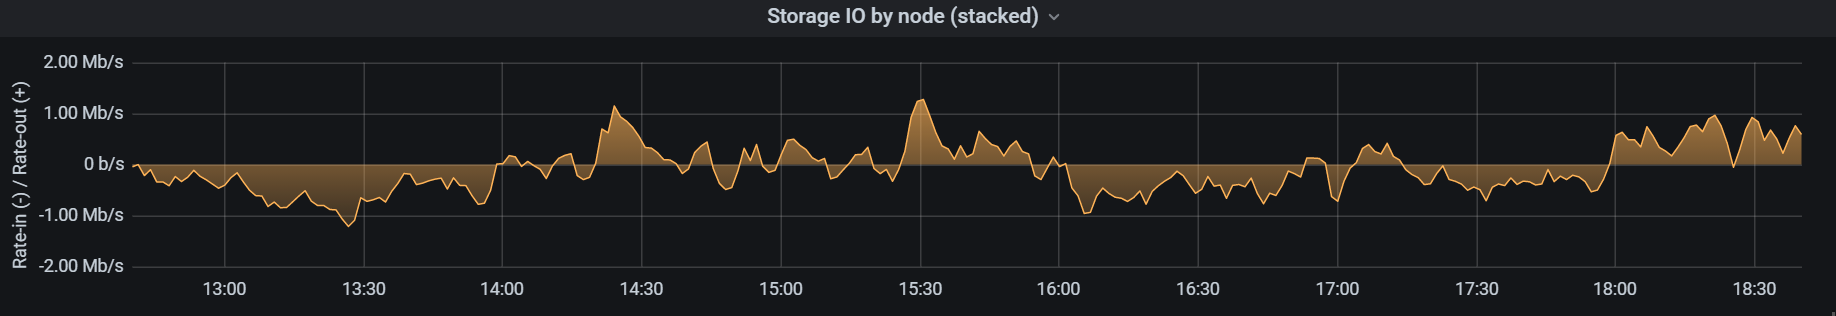
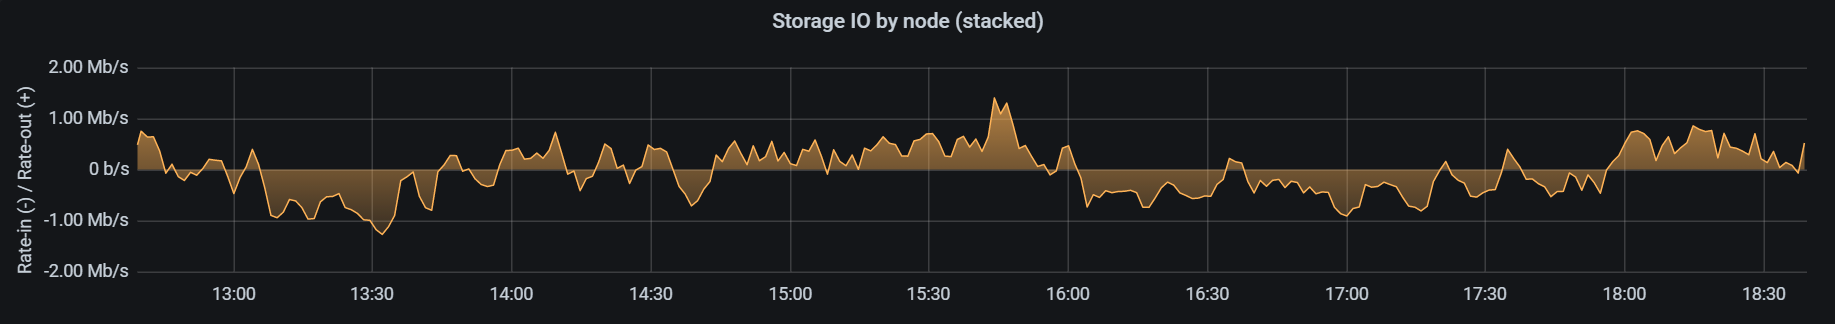
ah i totally didn’t understand what you where talking about… yes those spikes… no those aren’t problems, those are the system working as it is suppose to… to reduce latency and iops i use a cache, so that all the writes are done at defined points which is what makes the spikes, they are the cache writes which takes and confirms sync writes quickly, while making random write iops into sequential iops, and thus helps reduce latency over all… this does that the hdd writes in packets of up to 6GB
but usually it’s more like 5 MB… not sure i could sustain 6GB anyways…
so yeah those spikes are there because the system is running correctly, i’m use to it having to look like that, so i don’t see it as a fault, i regard the sustained activity as disorganized and ineffective… remember that during the pauses where the disks aren’t writing they will be ready to read or reading… which gives them near perfect latency for that time anyways… and the writes are over in like 1/20th of the time because they are not random iops after hitting the cache and stewing for a few seconds.
i checked each spike and valley is just about the size of 5sec, which is the SLOG time
which is why i got about 6GB for the SLOG, that means it can sustain ingoing data at up to 10Gbit rates, even if the hdd writes might have a bit of trouble keeping up… but for large files and such i have no doubt it would get close… sadly i don’t really have the bandwidth to test it sustained…
and not much fun in using a RAM drive.
so yeah no the spikes are a good sign, i worked to get them there and look as orderly as that, all across the board all the …12 hdd run like that… (had to check in zfs lol not use to having this many drives lol) you should really use a slog, it makes the world of a difference for disk latency and iops
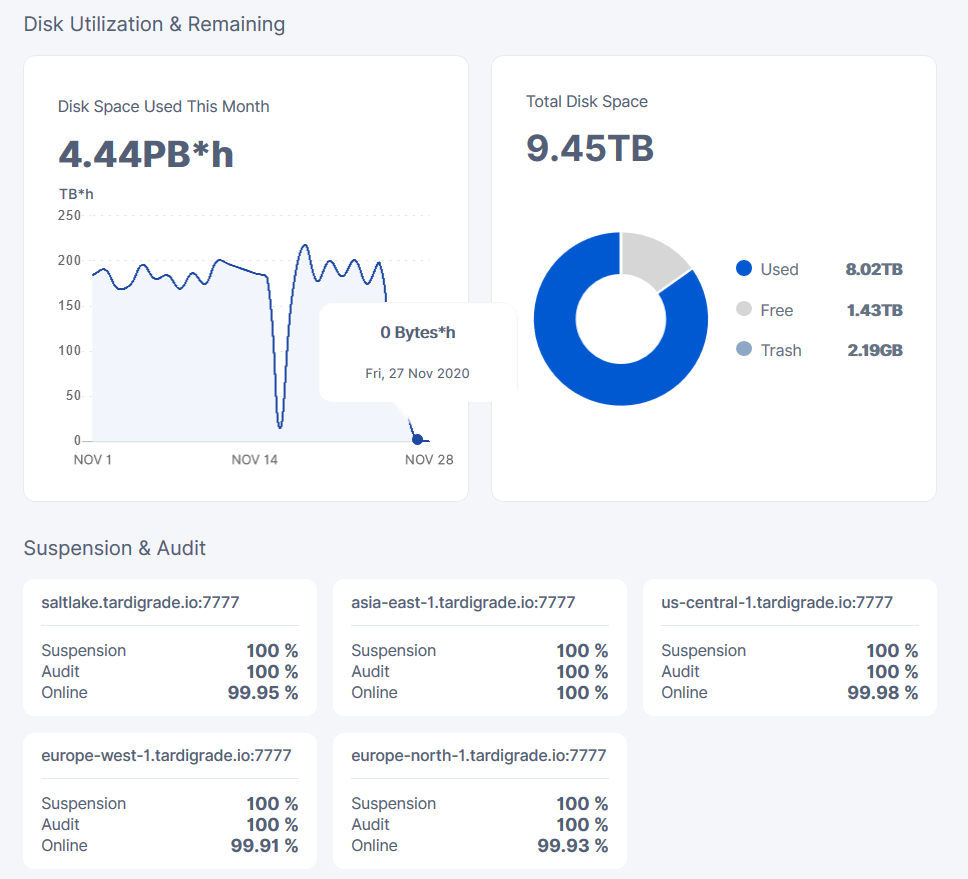
@daniel1 It might be just you: a plain zero is always suspicious.
Try Cyrl+F5 to force a full refresh of the dashboard, then check your logs if it doesn’t solve the issue.
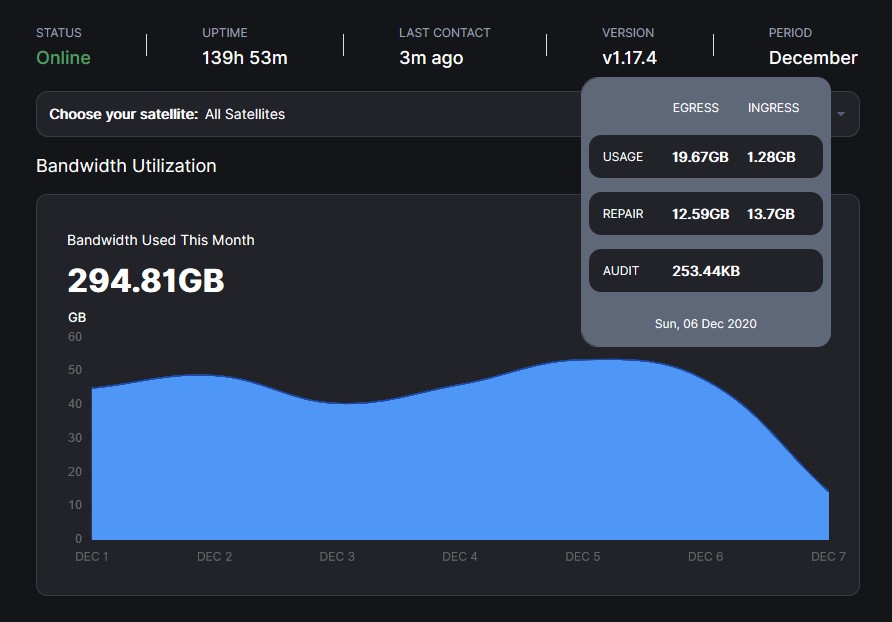
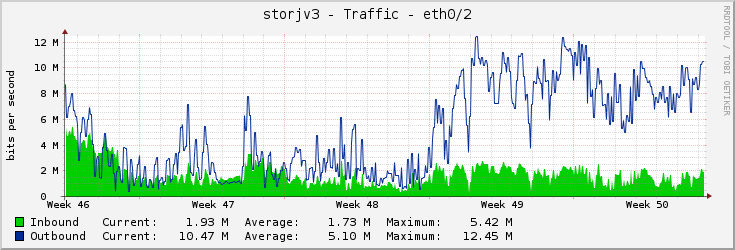
My nodes do have a bit of activity today:
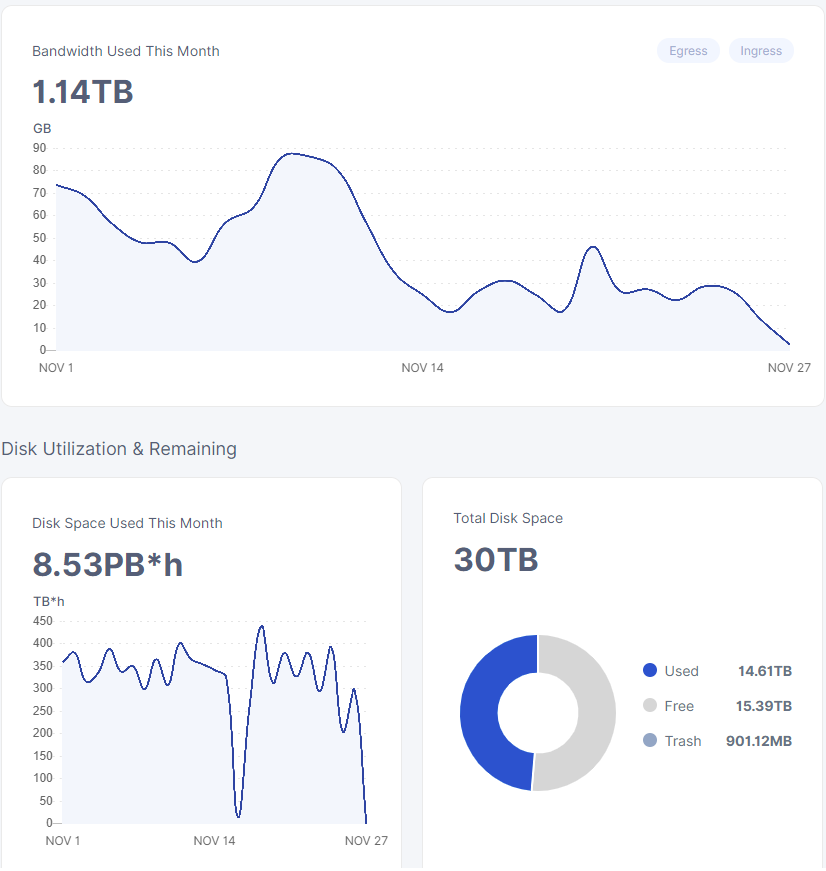
Im getting ingress and egress but my Disk Utilization shows 0
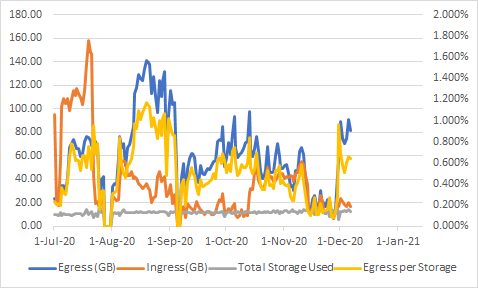
no need to worry about the disk space used this month graph.
its fairly unreliable in the first place and they are (AFAIK) changing out the whole system it’s based on…
so i wouldn’t worry about that one, no matter what it says right now…
and it’s also not really live data, it’s computed from how much data the satellites think you have, but sometimes they don’t have the processing power to compute it, which is why it can jump all over the place.
so disregard that one… and just look at the others… the total disk space is accurate and the bandwidth used this month shows the changes… sadly they haven’t added a deleted this month graph yet.
i should really do a follow up on the deleted graph thing…
Ok thanks. I just worried because i changed some setting on my vm and then i saw the graph and I thought something went wrong.
Aah right I crossed my wires… Wasn’t paying attention to the right chart. My bad.
So yeah I agree with @SGC, this chart always behaves this way: it’s usually invalid for the past 2 or 3 days.
ingress have been so low that my 1 new node has taken nearly 2 months to vet now…
or whatever it’s doing… i should check it, but haven’t bothered… it works that much i know
Yep, back up around Oct2020 levels for the time being
Anyone else seeing all those deletes in the colored logs ?
Way more purple than I’m used to hahahaha
yep, seeing an uptick in deletes as well.

takes a lot of deletes and a long time to go through them, so i doubt a few will change much…
did loose like 250gb that got trashed after i had 24 hours of dt on top of 9 hours of downtime a little week before…![]()
i should really get my colored log thing up and running again… every has been running so smoothly lately and many other things to do… so it’s sort of gotten down prioritized…
so dangerous tho, getting to comfy with everything just workings… sometimes i go like 4 days without checking my nodes … tsk tsk
I appear to be getting for every TB held about 2GB of repair egress and about 8GB of repair ingress per IP
Does this mean that 1/500 of nodes die every day losing >10TB of redundancy?
It could be peoples nodes are going offline then it triggers a repair. Possibly the nodes ran into an issue after a restart, they don’t have an auto update setup and the node fails to start up.
Ive been watching http://storjnet.info/ ive seen many nodes drop out the last few days.
I make it 40TB of repair each day vs only 30TB of new data. I must be missing something
edit: no its worse because repair is 1 for 1 but ingest is erasure coded.
So repair is much higher than ingest?