If you tell me where you’re stuck with setting it up, I could help you.
@kevink
i think they are like me… they would like it to work…
but know / expect it to be complicated to setup and thus gave up without even trying lol
on a side note i found out why my netdata was constantly going bad… i was always setting the update to continuous and then it would choke itself eventually in a few days maybe a week… if i turn continuous update/refresh off when i don’t use it… it works fine…![]()
also i got all my proxmox graphs… so not really that required, but i have seen a good deal of prometheus / grafana features that i wouldn’t mind having.
was it a complicated setup? or a breeze
I have written a step-by-step Tutorial for using Monitoring with Grafana on Synology (docker) with My Setup:
Maybe give it a try;)
But its written in german ![]()
4 Likes
thanks, looks very well done… i’ll see if i cannot read most of it without cheating… ![]()
That’s really good. People can use chrome to get it translated in english.
Agreed. I’m not exactly native to Speaking German, but even I was able to understand it and mentally compared it to the steps that I followed and found it pretty inline with I performed on my Linux node.
I’m wondering though if a companion linux version would benefit for those that are on either CT/VM installs or ARM (Rpi/HC2) setups to follow as well. I know my crazy self has a whole separate CT in proxmox just for grafana/prometheus.
yes!!! this would be SUPER helpful for those of us in this scenario. I have 3 nodes, all on separate raspberry pis, all running raspbian OS, all here at the same location, and I would love to be able to get something like this set up to have one grafana dashboard that displays the stats of all three.
In previous attempts, I only got as far as starting the storj-exporter docker container, but then had absolutely no idea what to do next, i.e. configure the exporter (if that’s even necessary), then what ever I’d need to do to get promethus working, and grafana as well. I love (what my limited understanding) the capabilities that seem to be possible when it’s all set up right.
If there are any step by step tutorials available to get everything set up, please feel free to share. I’m sure it would be useful for a lot of people now, and in the future. It would be helpful to have the various scenarios of single node/single machine, multiple nodes/single machine, multiple nodes/multiple machines.
Anyways, at this point I’ve just lived with not geeking out with the grafana setup since it’s not necessarily needed to run the node…
1 Like
Video instructions or just write up? Or both?
Personally, I’m sure I could simply follow along with a write up as video instructions would most certainly take more time and effort. But at the same time, it’s always easier to follow along with a video…
1 Like
I guess I could quickly write something up tomorrow (if my migraine allows it).
3 Likes
I’ll try the step-by-steb tutorial @unrealSpeedy made (and practice my german on the same occasion lol) once I have a bit more time (after my exams) and maybe shoot you a private message in case I run into some trouble.
Last time I got about as far as @dragonhogan with the setup but then I couldn’t figure out how to import the data in grafana.
3 Likes
@TheMightyGreek @dragonhogan @kalloritis @SGC I created a How-To in
4 Likes
Only bit I see missing from there is about the plugin install for Boom tables- otherwise, solid.
Which part would that be? I thought this part of the docker run command installs all needed plugins:
-e "GF_INSTALL_PLUGINS=grafana-clock-panel,grafana-simple-json-datasource,michaeldmoore-multistat-panel,grafana-piechart-panel" \
Can’t remember having installed something else but it has been a long time since I set grafana up and I kept my data directory since.
IIRC, that is the way- I just didn’t see boom-tables as part of that, which is what the grafana dashboards use.
1 Like
Ah guess I forgot yesoreyeram-boomtable-panel, it sounds familiar, maybe I installed that manually. added to the how-to. Thanks!
I’ve ran the following to make sure I’ve got the right plugins:
docker exec grafana grafana-cli plugins install grafana-piechart-panel yesoreyeram-boomtable-panel
yeah I must have installed the boomtable plugin the same way once. piechart isn’t used though, but I experimented with it once (wasn’t good enough for what I wanted to do).
Been a couple of weeks since anyone has posted, assuming everyone else is seeing some pretty decent egress this month? Here’s where I’m at so far:
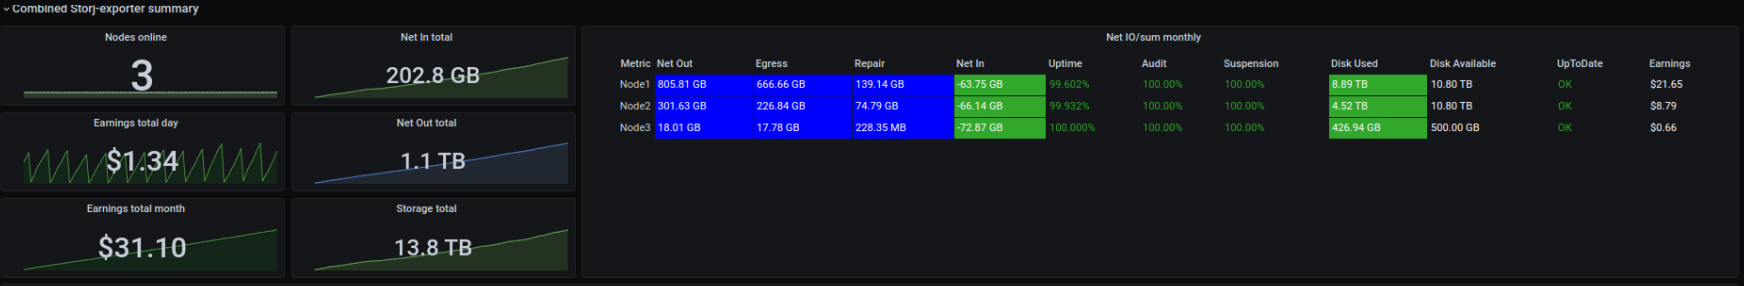
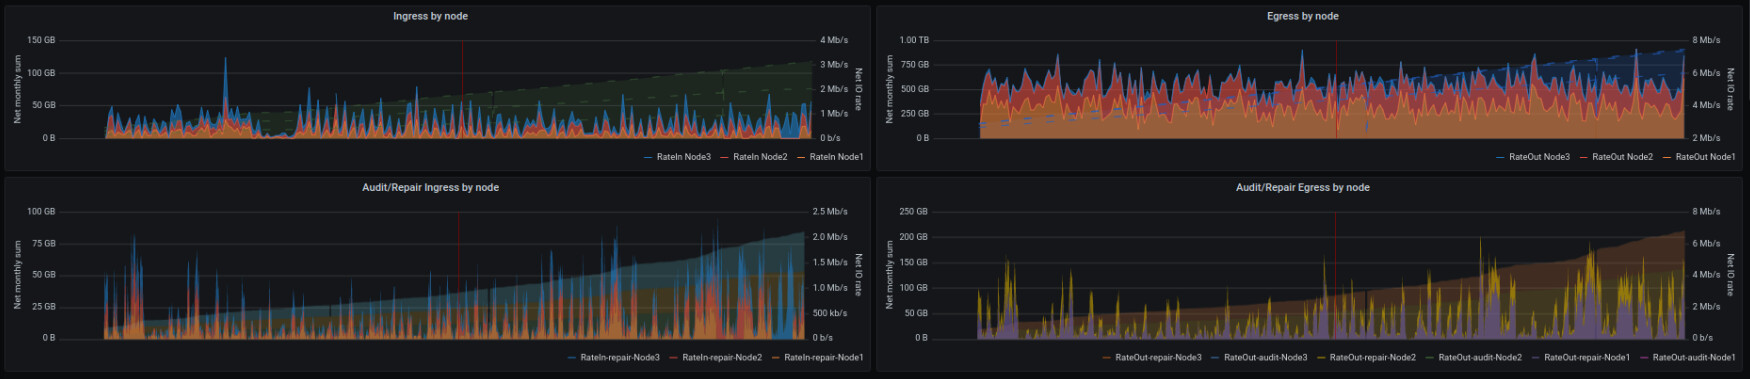
Big props to @kevink for getting the storj-exporter/Prometheus/grafana “how to” posted. I’m absolutely loving this dashboard, almost too much…to the point of having already considered mounting a monitor on the wall so I could always see it…
4 Likes
![]() Totally understand that. I look at least 20 times a day at my dashboard… Kind of gives me peace seeing my nodes perform correctly and with such good egress
Totally understand that. I look at least 20 times a day at my dashboard… Kind of gives me peace seeing my nodes perform correctly and with such good egress ![]()
3 Likes