and yes i did have to include my smooth memory utilization chart… just so people can see that it’s not always it jumps around…
seems to have something to do with uptime / storagenode activity changes / filewalker or something
and if i do turn down the memory max, then it will still run… not sure if it affects it, but has some nodes that are slowly getting to the level where i could do testing on them to compare behaviors of such things.
do one with like 200mb or less ram and one with more than it can use
or something… just to really make as wide a gap as possible.
see what it does on behavior
The ironic bit is that the newest node (started early this month) only saw one big pop of about half a gig being deleted from US2 and then nothing since. This kinda leads me to believe this is some 2020 or older data being cleaned up by a client (would need to be a massive client, for sure).
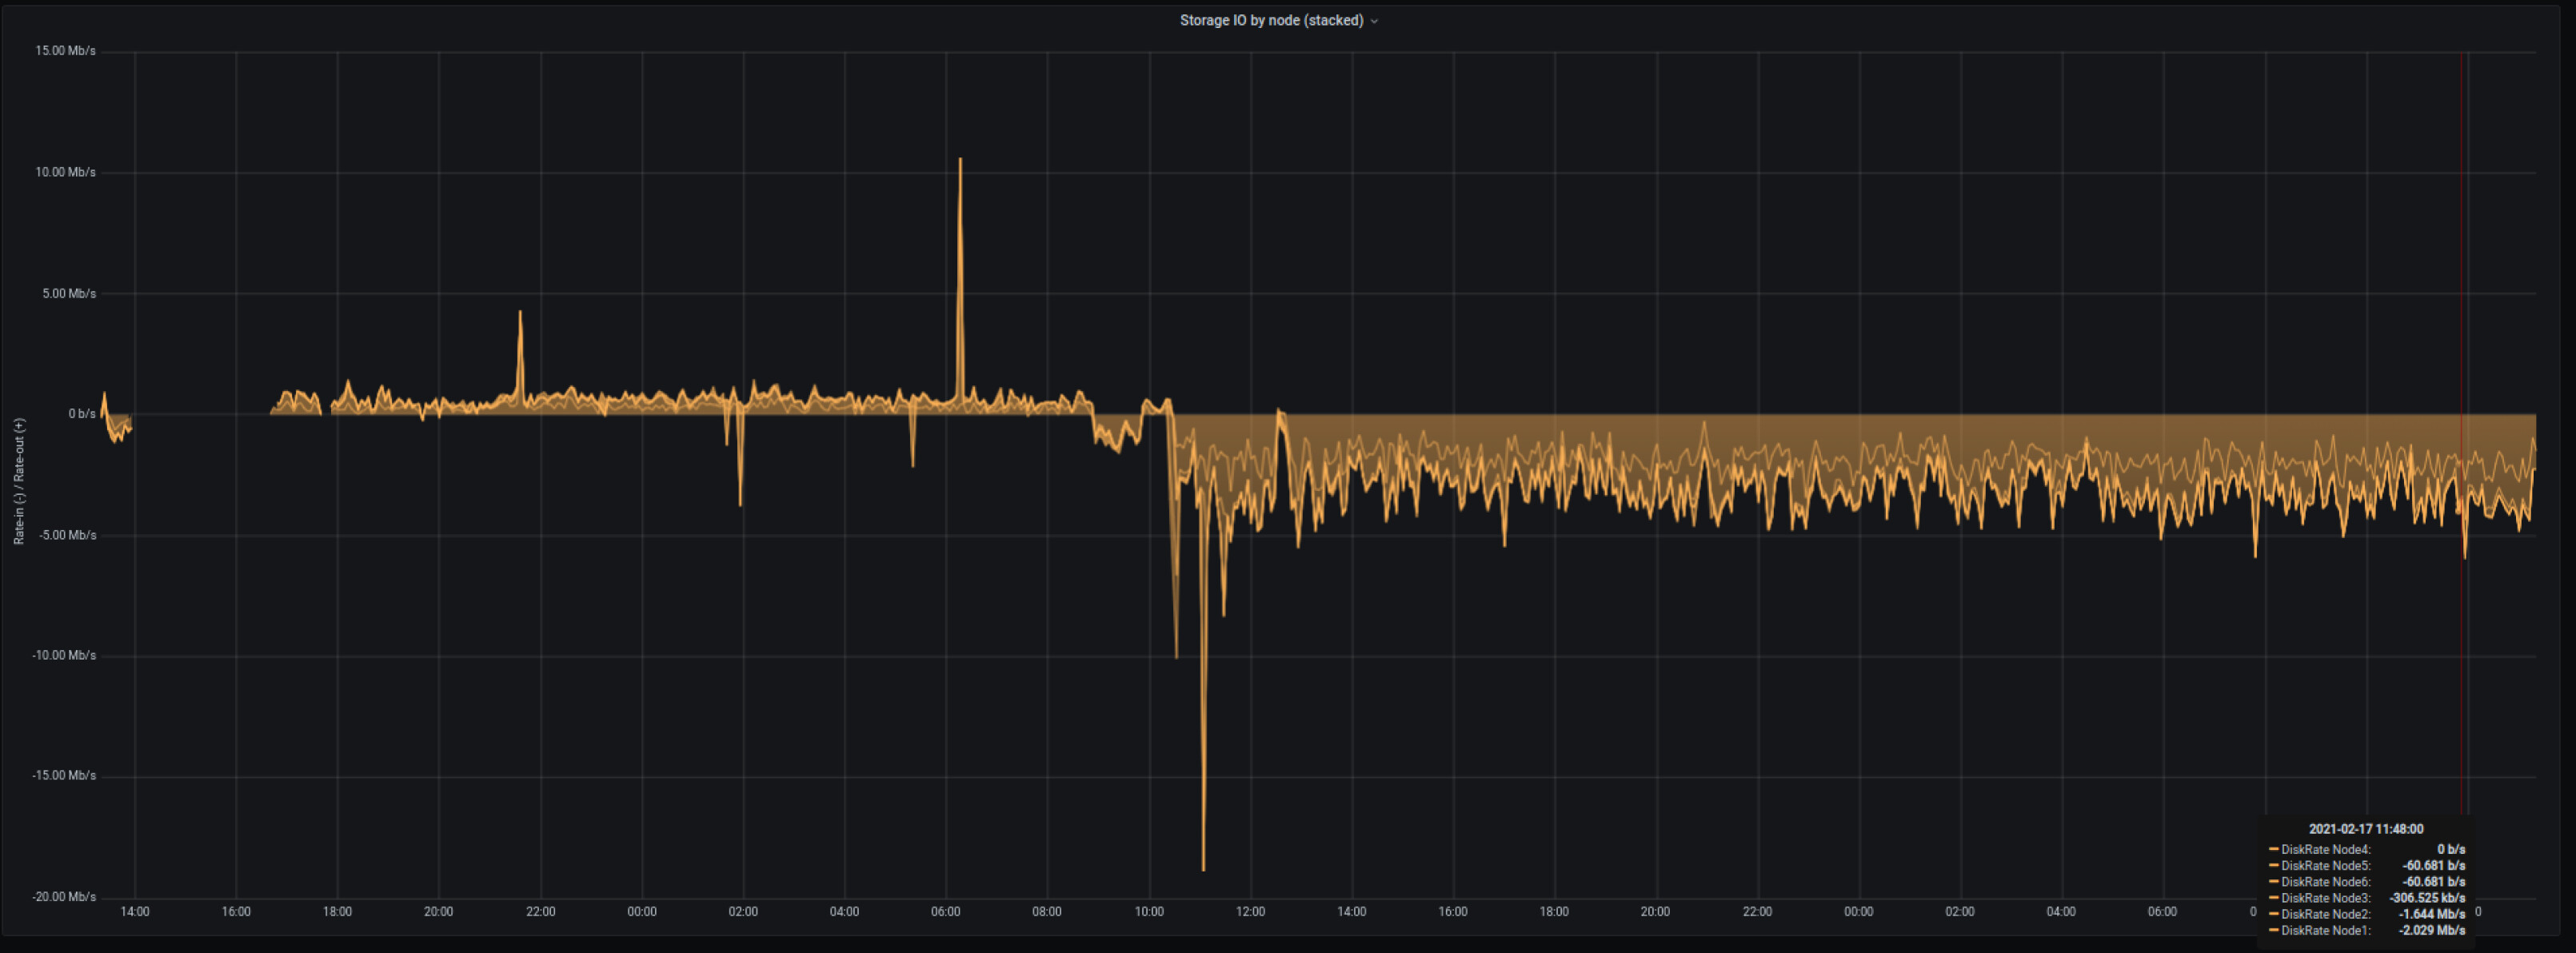
What interface are you using here? Especially in the bottom pic?
Also, do you run them all on different IPs or the same?
→ From what I am reading here it seems that there are just too many nodes in Europe or too little data to fill them. All the US peps are getting so much more in comparison. If i have a look at Disk Space Usage graph its not really going anywhere