This doesn’t seem right. I have a problem with how this is displayed because used and overused are essentially both “used”

also experiencing shrinkage here… ![]()
yeah that is terrible, not sure how to show it off better,
maybe set it to 500gb capacity since thats the minimum recommended… maybe 100gb makes the diagrams screwy… i mean thats suppose to show 1/8th or 7/8th…
thats just plain wrong…
Anyone noticed a decrease in successrate recently? Wondering if it’s specific to my set up here at home, or if it’s something others have seen as well.
Specifically, it seems like my download successrate has dropped dramatically, (from ~90-95%, down to ~70%, with a 5% failure rate and a 25% cancel rate). I seem to recall that this noticeable decrease started maybe about a month or so ago.
I just did a log searches for both “canceled” and “failed” and found that it looks like 95-98% of the canceled and failed downloads are coming from the Europe North satellite…so I suppose due to locality (based in US) this could be a reason for so many canceled downloads? Just not “winning” the race against faster/closer nodes? And I guess the big decrease could simply be just a higher ratio of downloads occurring over the past few weeks from that satellite compared to the others?
But for the “failed” downloads, I see a lot of the following message:
download failed {"Piece ID": "OEPWAGHVFLMJKV5D4MF4KJT3VXTDFA6FXXCOTOQXYUJWYUM4VMTA", "Satellite ID": "12rfG3sh9NCWiX3ivPjq2HtdLmbqCrvHVEzJubnzFzosMuawymB", "Action": "GET", "error": "write tcp 172.17.0.3:28967->168.119.243.243:52564: use of closed network connection", "errorVerbose": "write tcp 172.17.0.3:28967->168.119.243.243:52564: use of closed network connection\n\tstorj.io/drpc/drpcstream.(*Stream).pollWrite:228\n\tstorj.io/drpc/drpcwire.SplitN:29\n\tstorj.io/drpc/drpcstream.(*Stream).RawWrite:276\n\tstorj.io/drpc/drpcstream.(*Stream).MsgSend:322\n\tstorj.io/common/pb.(*drpcPiecestoreDownloadStream).Send:1118\n\tstorj.io/storj/storagenode/piecestore.(*Endpoint).Download.func5.1:580\n\tstorj.io/common/rpc/rpctimeout.Run.func1:22"}
I know that there was a node update around the time I started seeing the download successrate decrease, but also right around that time, I installed a new router…which is a ubiquiti UDM-Pro. I have 1gig fiber up and down, and I know I’m getting ~950mbps up and down per the speedtests on various devices.
Any comparison would be appreciated as I continue to ponder what could be causing such high download cancel rates…
Even with 5 nodes on 3 HDDs over 5 subnets my successrate for download was >97% unless my HDDs were really busy, then it dropped shortly, but never below 90%. But maybe it’s a location issue? My IPs are all in Germany.
it’s not impossible than when the udp thing starts going live, some people might have a very big advantage, however i doubt that is what you are seeing… but it’s an option.
my successrates have been moving downwards a little… but thought it was just me stressing my drives.
and it was only like 0.9% decrease yesterday it was at 99.5%
high cancel rates and basic failed downloads and uploads can be directly correlated to latency.
this is ofc the full system latency… from customer sends request to it hits your system, the time the system takes to find the data and send the piece to the customer.
roundtrip or whatever one want to call it.
been testing this for a while and i can usually keep a 99.9% download successrate and 99.7% upload successrates…
not exactly sure why i loose the 0.3% in upload successrates… my ssd can take data in microseconds
so 0.1ms 1us or whatever that …
its fixed and have been fixed for months on end… 0.3% always kinda bothers me, because then i don’t have 99.9% across the board… lol or i didn’t before i started to load the system.
but yeah have done extensive tests on this… latency is equal successrates, so you can fairly easily measure if you have issues, which is what i wanted to know … how i could troubleshoot.
good luck
You could try and see what the size is of those pieces that fail to download or get canceled (search the piece id to seen when it was uploaded).
If the size is small (I’ve been seeing a lot of 512 byte pieces lately), the bandwidth you have doesn’t really matter and it’s all latency (geographic proximity in this case).
Edit: I’ve checked on my node (Europe, 1TB) and see around 90-95% success rate on downloads, similar for all satellites.
can anyone else confirm the drop in ingress today?
at around 7:00 AM GMT
14.6TB node, 12 months old,

just wondering if i got something misconfigured.
made some changes and wanted to be sure it wasn’t just a random event before i started digging into all my setup to figure out exactly what is going on with that drop… if it was just me.
because i really love digging around after a problem that wasn’t even there to begin with… 
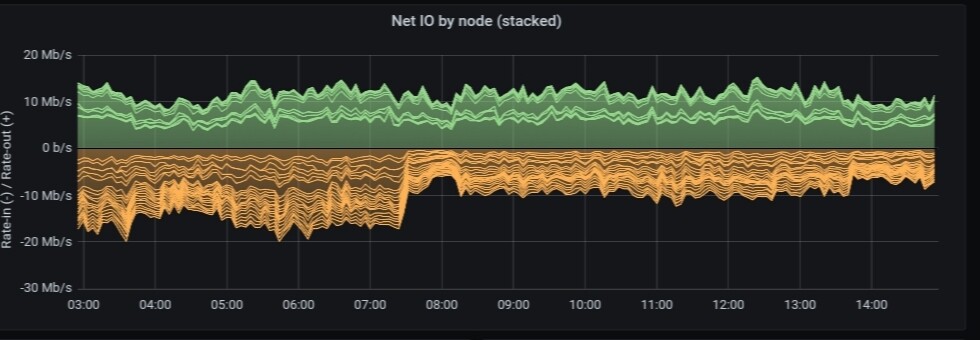
Yeah, I see it too, around 50% drop at 6:30 UTC
thanks atleast then i don’t have to start digging around of what was going on, hunting shadows is so frustrating.
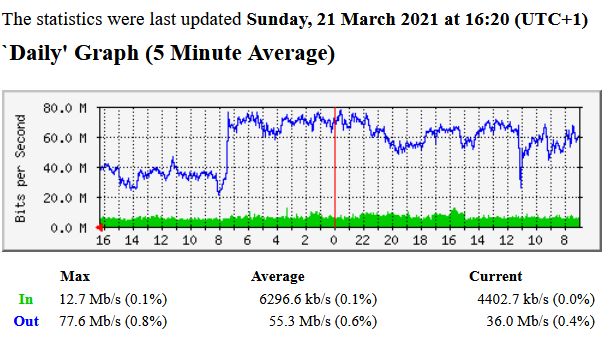
Seen from our Cisco ASR router 10G LAN port towards the Supermicro server.
In = Egress
Out = Ingress
th3van.dk
how much data do you have, to have this upload?
It is download (ingress) because the shown graph are measured on our Cisco router 10G LAN port.
Regarding how much data i have, you can find this info by looking at www.th3van.dk (preferable from a pc) and scroll down a bit :
th3van.dk
Hi guys, how in the world you get that high traffic? This is my second month with storj - I am vetted on 3 satellites, however my traffic is just pathetic.
Ingress is about 2-3GB per day, while Egress is 150-250MB. My internet plans is 300Mbit down 160Mbit up.
Will it increase over time?
in same boat as you not seeing that much ingress
You’re not comparing like for like.
- You have one node which is relatively new.
- Th3van has almost 40 nodes, most of which are on different /24 subnets, some of which are also very old compared to yours.
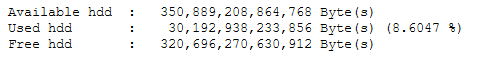
Upon closer look, it seems we both have similar data with Th3van Storage 39 server - I’ve started on 21st Feb (his on 27th) and we both have similar data in terms of ingress/egress and data on hard drives. It seems the difference comes from the number of nodes he has. His older nodes have 6x-7x egress, but also they have significantly more data (which is understandable). I guess nothing to worry about.
Months 1 and 2 i was the same sort of traffic as you. Month 3 I jumped up to 10-18 GB a day.
Wooo, the deletes are really screaming today. ~10 second bursts of many tens of deletes per second, never seen them go that fast before. Maybe I just hadn’t look at the right moment. A delete every 10-20 ms during burst.
Or is that the trash emptying?
Oh wow 149GB is a lot. I have 16GB at the moment, guess I didn’t have a lot of the data you did.