did i say i hate that graph… maybe i did… doesn’t matter.
not like it can be overstated… how … much … i … hate … that …graph
There’s plenty of improvements to be made. From my experience, people in general don’t fix details unless it breaks something or stuff that doesn’t cause more than a couple of people to complain.
MVP is always a priority of course, it’s just that I’ve seen so much mature software with details wrong.
yeah but people question it from time to time… that wastes time… so they could have just disabled it…
and somebody had to make that graph work… and never realized it wouldn’t work right…
also it’s not like its a technical fix… just avg it all out into a mostly straight line and one is good
so yeah i don’t get it…
seems like it would collectively waste more time by being there than it takes to fix it.
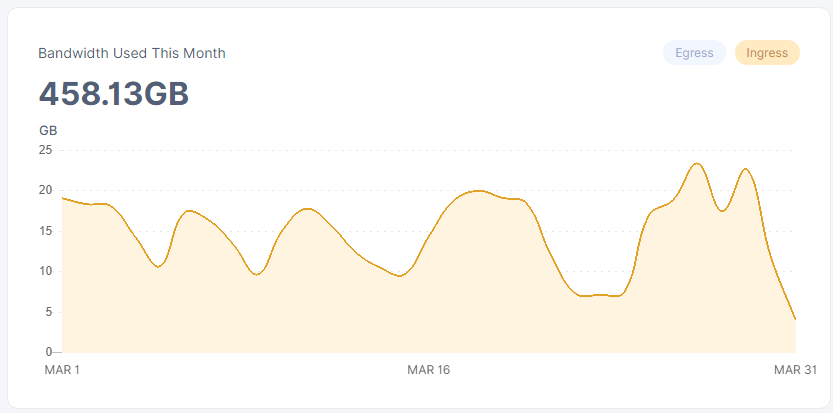
The graph should be there, it’s just that it isn’t accurate. It is accurate when you average it out. If they cannot get it accurate with reasonable effort, averaging last 10 days should be good enough. I’ve also said about the traffic graph that it should always show a minimum of 30 days because at the start of month it is useless.
These are mostly quality of life and “technically correct” improvements. They have much more important things to do so I hope it will get fixed in time.
Mostly “mildly infuriating” for us OCD guys. 
Like when people say kW instead of kWh, or worse, kW/h.
Watt you mean… ain’t nobody got time for that, just use joules… then everybody is happier, and by happier i mean eventually break down in tears before agreeing that watts is superior when utilized correctly.
to watts hour is like an h in the…
you barely really need it… ofc without it one is lost… but still it’s kinda a standard.
yeah well they have promised they would get on the quality of life issues… not to long ago
i hate the graph because it would take so little to disable it, and it wastes so much time…
and there is literally nothing gained from it.
Personally, I like the graph being there as it shows storage use/growth over time.
It is inaccurate, yes, but if you add a trendline/average it out (and convert from hours to month - why is it in TB*h and not TB*m btw?) you get how much data is actually stored each day (the ingress graph doesn’t account for deletes).
I’d much rather see it improved than removed.
Yeah, TB*m and averaging over a few days and it’d be great! And deletes shown would be nice too.
yeah already made a feature request for deletes, that was voted in i believe… been a while so hopefully we will be seeing that one day soon.
I have noticed over the last 2 days, 3x more than normal repair traffic for egress and ingress. I wonder if it is because the algorithm is filling in the gaps after offline nodes from the OVH fire.
Hmm, now that you mention it - there is an unusual amount of repair ingress last 3 days. But OVH fire happened much earlier even if there were nodes on there.
Has anyone else noticed a big dropoff in traffic over the last 36 hours ?
It’s dropped to almost 0 for me.
R
Looks normal…?

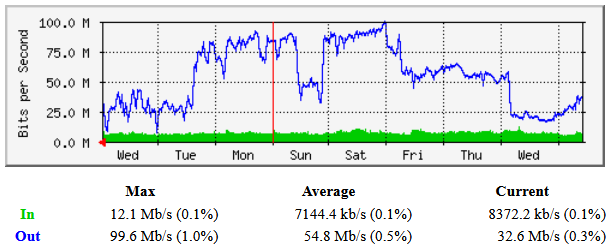
In = Egress
Out = Ingress
th3van.dk
Normal over here too, check your setup…
dropped to just 2gb/day the last couple days
That’s what I’m experiencing too. I see it across all my nodes (different subnets). I’m averaging around 2.5gb/day for each node.
happens often around the end of the month.
everyone is seeing the same thing.
i’m getting more around 5gb a day ingress, but that is most likely because this is a fully vetted node and i think one of the satellites that has been idle for a while has started sending data again.
so many of the newer nodes, even my 6-8 month old nodes are still not vetted on this satellite and is seeing the same 2.5 gb ingress pr day.
But in my opinion there is another issue associated. The number of nodes increased rapidly over the past few months. my biggest worry is the same that happened to all the crypto mining. The network will become oversaturated by nodes that provide lots of storage and not enough clients to utilize them. This can be seen already now as in past I could Ingress a cool 1Tb a month now I’m lucky if it is 400GB. If it continues this way I’m worried only the big fish will be able to stay on storj and will no longer be decentralized.
main thing that will effect storj is the fact there are fully decentralised alternatives available that are under 1/2 the price right now storj has the lead on capacity use but if that changes you could see a big shift away and thats not good for anybody as the more storage options available
the better