Yes, it should be. But others reported that if you restart, your node likely will double account the used storage, so it may report itself to the satellites, that’s full, so it could stop an ingress.
The workaround is known - delete the prefixes database and restart.
It’s not fully confirmed though.
For me:
Node slowly grew in size whilst conversion was running.
A restart doubled the reported size. Subsequent restart added the original size of node again. Ingres stopped when node size exceeded max node size.
Stop node. Delete used_by_prefix database. Start node. Node size returned to its physical size.
The lazy fileworker: # run garbage collection and used-space calculation filewalkers as a separate subprocess with lower IO priority
pieces.enable-lazy-filewalker: true
The old startup-scan: # if set to true, all pieces disk usage is recalculated on startup
storage2.piece-scan-on-startup: true
Both should be set to true or? Is the startup-scan also going trough all the hashstore-logs and restoring the databases from it?
And the lazy-filewalker is already working with the hashstore-logs?
On some other STORJ-Node without migration I also see so much trash unfortunately. I now deleted the used_space_per_prefix.db, for sure backed it up in another folder, and it is new recreated. Also running startup2-scan and lazy-filewalker-scan on it.
Both can be in any state or commented out to have their defaults.
What do you call trash? The value on the dashboard or the folder on the disk?
Could you please compare the size of the trash folder with the value on the dashboard?
Remember that after migration, trash is not stored in the trash folder, but part of the hashstore files. So counting that path will likely just give you part of the complete used space for trash.
Now I switched all my nodes to passive hashstore. Some are passive and active and rewriting the files. Unfortunately it does take months…But yeah it is what it is and there is no other way.
Basicly 0% cancel-rate. Now with two newer nodes, full on hashstore:
3008
742
71
23
2179
1188
64
33
As you can see it’s 2% to 3%. Most of my nodes are 2% to 3%, didn’t experience 10% to 30% yet.
All the four new nodes are on SSD’s so it’s not related to some probably poor HDD I/O performance.
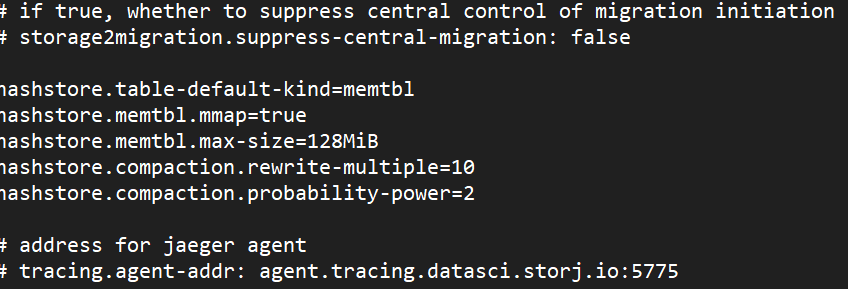
Now I want to activate the memtbl.
Just put this into the config file:
hashstore.table-default-kind=memtbl
hashstore.memtbl.mmap=true
hashstore.memtbl.max-size=128MiB
hashstore.compaction.rewrite-multiple=10
hashstore.compaction.probability-power=2
That’s why you don’t rely on AI for actual troubleshooting.
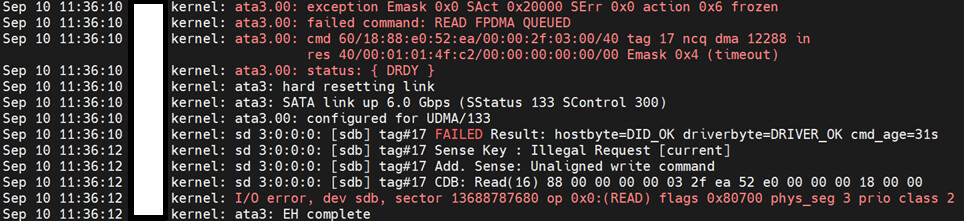
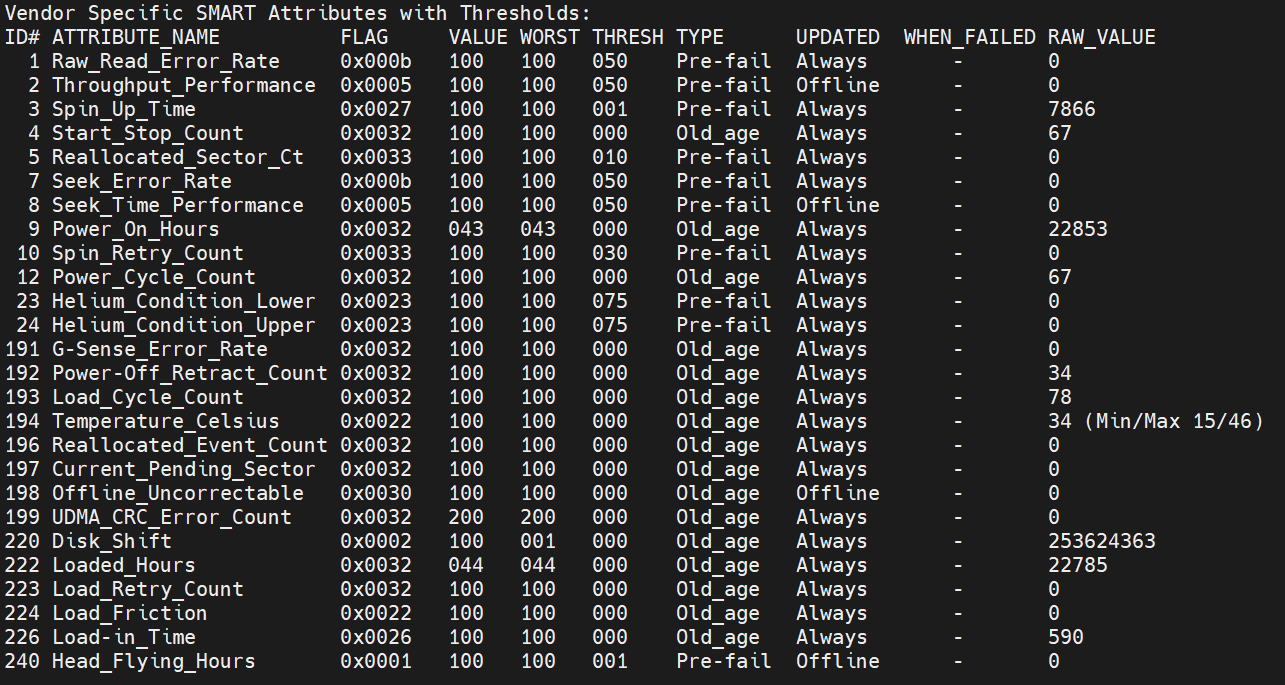
Your disk returned an IO error (second to last line). Your disk and/or cable is failing to return proper data. Post your complete SMART so we can troubleshoot it.
AI ist super grat for knowledge-gaining and trouble-shooting. Hopefully it stays and advances, even though it’s maintenance cost for the maintainer should be very high.