Connection reset by peer errors

Any idea what’s happening here? I usually run clean on my logs…

|2023-03-17T00:58:09.345Z|ERROR|piecestore|download failed|{Process: storagenode, Piece ID: A22EEU2WLTB44JYCRTAAJ2LKVOSUGWBLKNXF42L4SSTMVDLLILTA, Satellite ID: 12EayRS2V1kEsWESU9QMRseFhdxYxKicsiFmxrsLZHeLUtdps3S, Action: GET, Offset: 890880, Size: 2560, Remote Address: 184.104.224.98:35130, error: manager closed: read tcp 172.17.0.3:28967->184.104.224.98:35130: read: connection reset by peer, errorVerbose: manager closed: read tcp 172.17.0.3:28967->184.104.224.98:35130: read: connection reset by peer\n\tgithub.com/jtolio/noiseconn.(*Conn).readMsg:183\n\tgithub.com/jtolio/noiseconn.(*Conn).Read:143\n\tstorj.io/drpc/drpcwire.(*Reader).ReadPacketUsing:96\n\tstorj.io/drpc/drpcmanager.(*Manager).manageReader:223}|
|---|---|---|---|---|
|2023-03-17T00:58:11.128Z|ERROR|piecestore|download failed|{Process: storagenode, Piece ID: KJKPYYDO2UMIVLMXMT2TWROIIXXZXG7SQAA5YBGQRCO2E2FPBADQ, Satellite ID: 12L9ZFwhzVpuEKMUNUqkaTLGzwY9G24tbiigLiXpmZWKwmcNDDs, Action: GET, Offset: 642560, Size: 65536, Remote Address: 184.104.224.98:60526, error: manager closed: read tcp 172.17.0.3:28967->184.104.224.98:60526: read: connection reset by peer, errorVerbose: manager closed: read tcp 172.17.0.3:28967->184.104.224.98:60526: read: connection reset by peer\n\tgithub.com/jtolio/noiseconn.(*Conn).readMsg:183\n\tgithub.com/jtolio/noiseconn.(*Conn).Read:143\n\tstorj.io/drpc/drpcwire.(*Reader).ReadPacketUsing:96\n\tstorj.io/drpc/drpcmanager.(*Manager).manageReader:223}|
|2023-03-17T00:58:11.181Z|ERROR|piecestore|download failed|{Process: storagenode, Piece ID: 5XRKDAHBWCXC23XOYOFA7X2VYAY4XSSDOIRT2YBM3BLKUKL4HYWQ, Satellite ID: 12L9ZFwhzVpuEKMUNUqkaTLGzwY9G24tbiigLiXpmZWKwmcNDDs, Action: GET, Offset: 900864, Size: 65536, Remote Address: 184.104.224.98:60536, error: manager closed: read tcp 172.17.0.3:28967->184.104.224.98:60536: read: connection reset by peer, errorVerbose: manager closed: read tcp 172.17.0.3:28967->184.104.224.98:60536: read: connection reset by peer\n\tgithub.com/jtolio/noiseconn.(*Conn).readMsg:183\n\tgithub.com/jtolio/noiseconn.(*Conn).Read:143\n\tstorj.io/drpc/drpcwire.(*Reader).ReadPacketUsing:96\n\tstorj.io/drpc/drpcmanager.(*Manager).manageReader:223}|
|2023-03-17T00:58:11.412Z|ERROR|piecestore|download failed|{Process: storagenode, Piece ID: 2VQPPPGWI5AIKUQ47H7DCVCDEZD235K3TNTN73GM7D57EIWA4DLA, Satellite ID: 12L9ZFwhzVpuEKMUNUqkaTLGzwY9G24tbiigLiXpmZWKwmcNDDs, Action: GET, Offset: 0, Size: 65536, Remote Address: 149.6.140.106:17698, error: manager closed: read tcp 172.17.0.3:28967->149.6.140.106:17698: read: connection reset by peer, errorVerbose: manager closed: read tcp 172.17.0.3:28967->149.6.140.106:17698: read: connection reset by peer\n\tgithub.com/jtolio/noiseconn.(*Conn).readMsg:183\n\tgithub.com/jtolio/noiseconn.(*Conn).Read:143\n\tstorj.io/drpc/drpcwire.(*Reader).ReadPacketUsing:96\n\tstorj.io/drpc/drpcmanager.(*Manager).manageReader:223}|
|2023-03-17T00:58:12.356Z|ERROR|piecestore|download failed|{Process: storagenode, Piece ID: UFVNI5HABBGFU2UHWXQHZ|

Today, we rolled out Noise in production to our edge gateways.

As part of the Noise rollout, we discovered that (1) our TLS stack has not been doing clean connection shutdown, and (2) Noise was. Unfortunately, we have gotten used to some of the side effects of not doing clean shutdown, so we also rolled out this change: https://review.dev.storj.io/c/storj/common/+/9906/3/rpc/connector.go (make sure to see the comment).

This is a bummer but in retrospect unsurprising that the nodes are now reacting this way. The reason TLS didn’t have these log messages is because the application logic was clued in that the connection was shutting down, so the connection reset that was still happening was swallowed and ignored.

What I don’t know is if your node is part of the winning set of nodes, and this is what happens even in a full success, or if this is the behavior your node sees only when it is canceled as part of a long tail. Do you have a hint there? Is this every request or just some? How frequent is this happening?

Assuming we continue the SetLinger(0) approach, which we may re-evaluate, I’ll try to think about how to clean up the logs on the node side. Your node is behaving as expected though as far as I can tell.

2 Likes

Thanks for the quick response and transparency - it’s refreshing.

I am seeing 10-15 ERROR messages each minute, with so many ERROR messages it makes it difficult / impossible as a node operator to check-in for a quick status to ensure everything is going well, reclassifying these as WARN/INFO would allow us to still filter / alert on ERROR.

Uploaded my full log to Deleted if you would like to review.

10% download cancellation rate, 17% download failed rate on my nodes. Constantly. No other errors.

@cpare please remove the solved flag. :wink:

1 Like

Guys, some testing on production? :smiley:

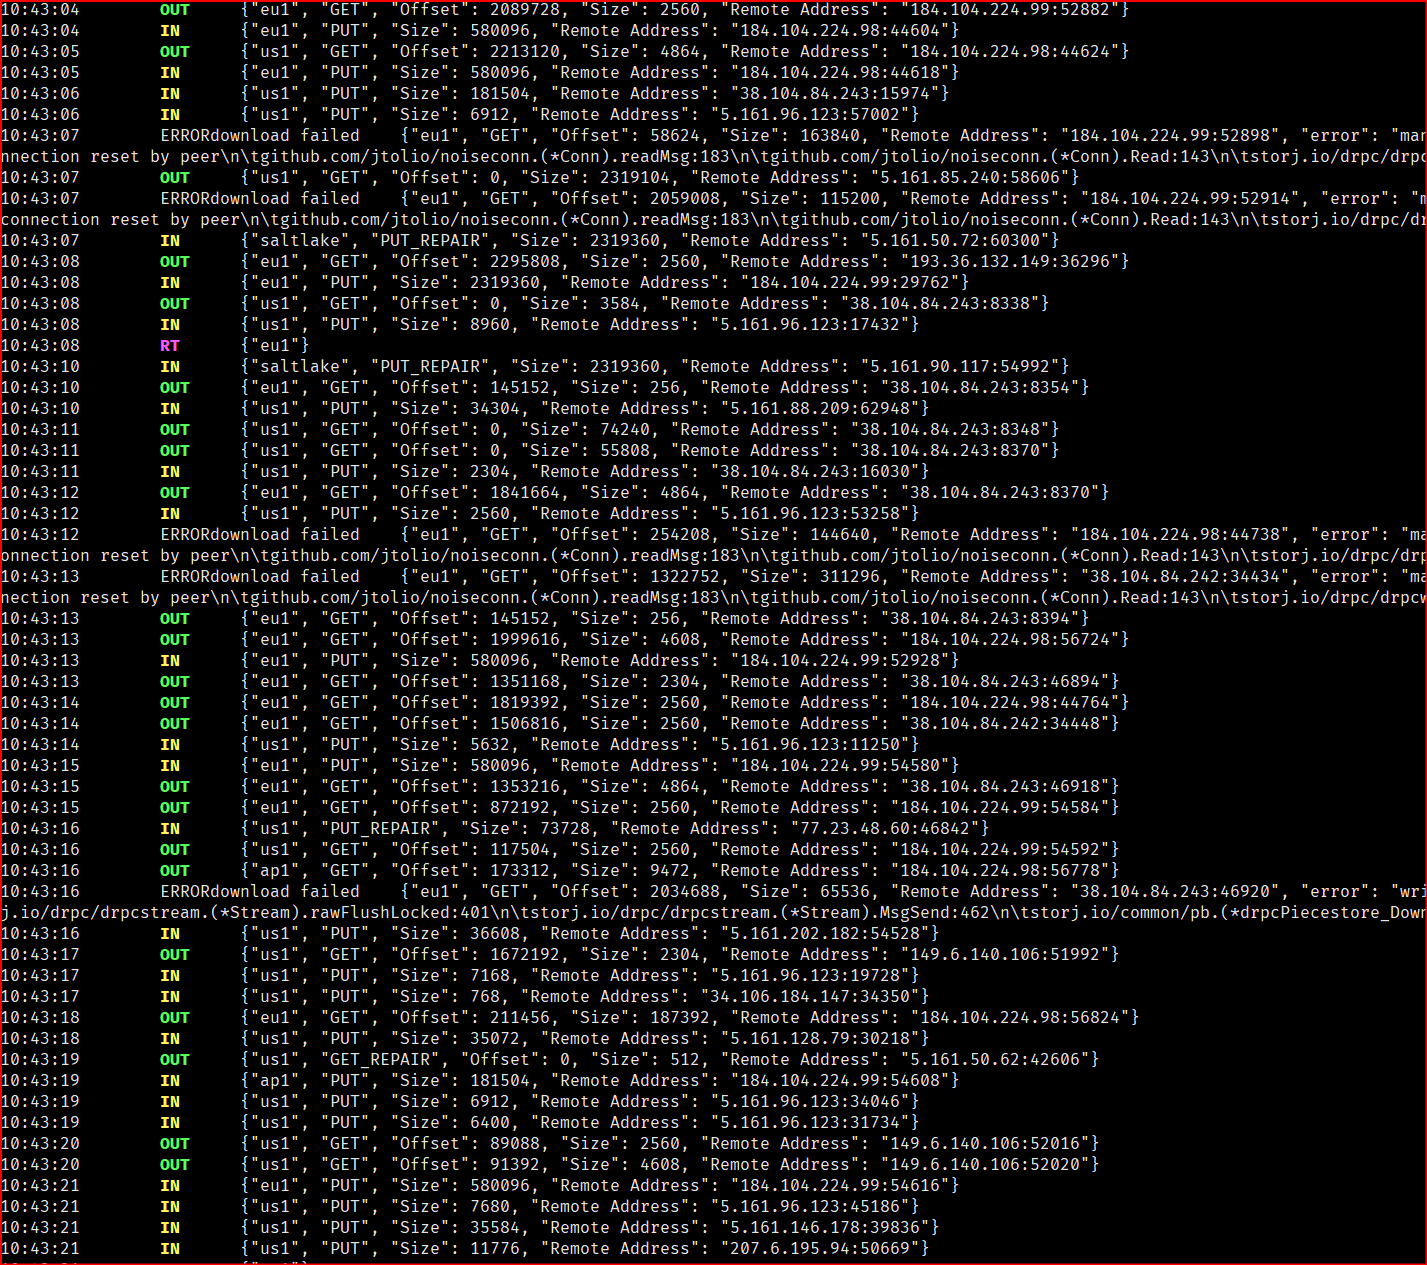
Every few seconds or less I see in storagenode logs errors like this:

...
connection reset by peer\n\tgithub.com/jtolio/noiseconn.(*Conn).readMsg:183\n\tgithub.com/jtolio/noiseconn.(*Conn).Read:143\n\tstorj.io/drpc/drpcwire.(*Reader).ReadPacketUsing:96\n\tstorj.io/drpc/drpcmanager.(*Manager).manageReader:223"}

What is happening?

edit:
I’ve already made this:

sysctl -w net.ipv4.tcp_fastopen=3

Nothing changed.

@jtolio interesting alternative to reduce SNOs income :crazy_face: From 100% to 70% due to these network changes?

Is there anything I can do to reduce the number of failed downloads?

21,186 “noiseconn” cass of 31,917 “failed downloads” in total. That’s incredible 2/3 !!

The others are:

2023-03-12T09:52:44.958Z	ERROR	piecestore	download failed	{"Process": "storagenode", "Piece ID": "BPYYJ4CDI6YRVWGO5QITX637S7PSBB6F4LBOCZZGIP3I246OV23A", "Satellite ID": "12EayRS2V1kEsWESU9QMRseFhdxYxKicsiFmxrsLZHeLUtdps3S", "Action": "GET", "Offset": 0, "Size": 532480, "Remote Address": "5.161.91.88:21232", "error": "manager closed: read tcp 172.17.0.6:28967->5.161.91.88:21232: read: connection reset by peer", "errorVerbose": "manager closed: read tcp 172.17.0.6:28967->5.161.91.88:21232: read: connection reset by peer\n\tstorj.io/drpc/drpcmanager.(*Manager).manageReader:225"}

and

2023-03-12T09:48:51.935Z	ERROR	piecestore	download failed	{"Process": "storagenode", "Piece ID": "B5TE46UOJ3TE4ZMQZODNTDM3CJLUA7RH2N35E6W26WAHZOKEMS7Q", "Satellite ID": "12L9ZFwhzVpuEKMUNUqkaTLGzwY9G24tbiigLiXpmZWKwmcNDDs", "Action": "GET", "Offset": 6144, "Size": 163840, "Remote Address": "184.104.224.99:56116", "error": "write tcp 172.17.0.6:28967->184.104.224.99:56116: use of closed network connection", "errorVerbose": "write tcp 172.17.0.6:28967->184.104.224.99:56116: use of closed network connection\n\tstorj.io/drpc/drpcstream.(*Stream).rawWriteLocked:367\n\tstorj.io/drpc/drpcstream.(*Stream).MsgSend:458\n\tstorj.io/common/pb.(*drpcPiecestore_DownloadStream).Send:349\n\tstorj.io/storj/storagenode/piecestore.(*Endpoint).Download.func6.2:729\n\tstorj.io/common/rpc/rpctimeout.Run.func1:22"}

and

2023-03-12T09:40:52.062Z	ERROR	piecestore	download failed	{"Process": "storagenode", "Piece ID": "ZSQTM7CK7OGUK5WNGIGQDB5U2YCOH3VEFTG7CISJKLPVNL2DVETA", "Satellite ID": "12L9ZFwhzVpuEKMUNUqkaTLGzwY9G24tbiigLiXpmZWKwmcNDDs", "Action": "GET", "Offset": 33024, "Size": 163840, "Remote Address": "184.104.224.98:63620", "error": "write tcp 172.17.0.6:28967->184.104.224.98:63620: write: broken pipe", "errorVerbose": "write tcp 172.17.0.6:28967->184.104.224.98:63620: write: broken pipe\n\tstorj.io/drpc/drpcstream.(*Stream).rawWriteLocked:367\n\tstorj.io/drpc/drpcstream.(*Stream).MsgSend:458\n\tstorj.io/common/pb.(*drpcPiecestore_DownloadStream).Send:349\n\tstorj.io/storj/storagenode/piecestore.(*Endpoint).Download.func6.2:729\n\tstorj.io/common/rpc/rpctimeout.Run.func1:22"}

Why? Dev provided a clear explanation of what happened - they have not been doing a clean shutdown for some time, we’re just seeing the ERROR messages now. Dev also confirmed that although these messages are appearing in our logs, they are not problematic, and have likely been suppressed prior to this release.

Is there an Enhancement Release needed to suppress the errors? Yes.
Are the presence of these errors indicative of a configuration problem? No

Dev explained above, you can ignore these errors until they are suppressed or the socket closed correctly in a future release.

Ok, as you can see above on my sed processed live log, some (most?) of downloads (green out) don’t have this error, so it can be only for canceled/losing race requests, for sure not for all.
Frequency varies a lot. It is disturbing that so far SNOs have not known about the number of canceled downloads.

Thanks, for me it looks like this :slight_smile: :

- Why do I suddenly hear so many gunshots?
- Relax, they will shoot without silencers for a while. There is nothing to worry about.
- Ah so? Until now I thought it was a quiet neighborhood.

IMO It isn’t simple error to ignore. It appears that all this time the SNOs were unaware of what was going on, that the success rate is much lower than they thought. It’s just that the errors were hidden and it is to be expected that they will be in the future.

Until now I had maybe 1 “connection reset by peer” error every few minutes, now average every few seconds.

2 Likes

Thank you for speaking out. I wondered why those messages should have been hidden in the past or why they will not be visible in future again - are stats tweaked or cancelled requests should be ignored anyway at all?

Sorry, I am confused the same way as you, @Dunc4n1d4h0, haha. Maybe @jtolio can bring some light into it, or @Alexey? Maybe also interesting for @BrightSilence referring the successrate.sh script (?).

1 Like

This was well known before, see e.g. Short-lived data - #9 by BrightSilence and Benchmark nodes - #30 by BrightSilence

2 Likes

Yeah, we’ve known the success rates we see can’t be correct, but we’ve never known the exact cause. I’m not sure this would explain that completely though. But if the solution leads to better logging of long tail cancellation that would be great.

I have seen a lot more cancelled transfers in the logs lately. Can this be connected? Haven’t yet noticed these errors though, but I haven’t looked for them specifically and I’m on my phone right now, so can’t easily check atm.

@Toyoo thank you! Wasn’t aware of that.

From what I could see those „noiseconn“ messages are 2/3 of the last days „download failed“ messages.

Meaning this does not explain the other +1/3, which are occurring additionally and weren’t logged in that amount before. :v:t2:

I have not noticed a significant increase in failed transfers on my end, just in cancelled ones. But I should add, that’s just based on casual glances at my logs scrolling by when I do other stuff.

At least those seem to be linked thematically to stopped, canceled connections and appeared in parallel more often than before.

But yes, there is much more canceled than before:

[sn1]
.. audits (r: 0.00%, c: 0.00%, s: 100%)
.. downloads (c: 16.55%, f: 3.59%, s: 80%)
.. uploads (c: 0.02%, f: 0.19%, s: 100%)
.. rep down (c: 0.00%, f: 0.00%, s: 100%)
.. rep up (c: 0.00%, f: 0.00%, s: 100%)

(I’ve ignored „noiseconn“ messages for that statistics)

Yeah, I wish information of this kind was available in organized form in the node documentation.

1 Like

The Community may continue to update this documentation: Error Codes: What they mean and Severity Level [READ FIRST]
It’s a wiki, so anyone member can edit and add new errors there.

But usually the search should find an answer.

That’s not the right place to put information on the meaning of success rates.

Then it should be added to the article for success rate script. But I do not know what is format?