Has anyone had their node pull constant 10 Mbps download traffic over a meaningful period of time? My connection is 50 Mbps downlink. I’ve seen it for the first time a few days ago. It is usually always some kinds of spikes in the graph, but I’ve been having almost a straight line sustained for many minutes on several occasion the last few days. Some changes in the latest versions perhaps?
I don’t graph my network stats, but have a window open with vnstat --live up most of the time and to answer your question, yes. over the past few days I’ve seen many long periods of time with rx rates maintained between 10-60 Mbit/s. Just for fun I manually log my SNO dashboard numbers on a daily basis (typically around 11pm each night) and every day this month I’ve had upwards of 150 GB of bandwidth used. Majority of it is incoming traffic from all of the new saltlake satellite.
Not around 10 Mbps but pretty much exactly 10 Mbps.

I’m trying to figure out if this is normal behaviour. It looks almost as if ISP is throttling the connection at some point. Or some other issue…
It’s great to hear there’s a lot of traffic. I’ve missed several days of uploads due to a migration so I have about half that.
Im seeing alot of inbound traffic aswell but its peaking at around 150Mbit and staying around 80Mbit to 40Mbit/s.

1 Like
same where been pretty stable at about 20-30mbit avg since the 1st
but still my node is only 5 weeks, so hoping to see better numbers in the future, seems kinda low for my setup, but it might also be related to my hdd capacity… at current speeds i will run out in 20 odd days.
but i have a new array coming online soon, so will be interesting to see if that actually increases my ingress data by a large factor.
@deathlessdd how much capacity do your node have ?
would sort of make sense to not fill up nodes faster than they can react to the changes, and spreading it out between many nodes ofc also gives more bandwidth for customers, and makes it less likely that the recorded free space on the storj network is more reliable.
when i’ve shutdown my node for brief periods, it seems that i get most of the data i missed… kinda like the satellites have a roadmap for how they want the data to be allocated on the network… and if you have been gone, you are getting most of what you missed…
but duno about that… needs more testing
my ingress and egress is fairly stable over long periods… or there are certain patterns… but from the 1st to the 8th i think my avg ingress was 20mbit/s more or less to the dot
again if i freely postulate, the satellites may in some way limit or guide that…
also take into account that some network graph software tends to make avg look much more even than they actually are…
net data looks quite spikey but in my other network monitoring software its basically a straightline most likely because its setup to calculate the avg, i’m sure that netdata also does that, but its resolution is just more detailed in the graphs, while the other software using more averages of the numbers.
i perfer the latter, but the more accurate netdata way is nice to see if the connection actually peaks out… the latter graph avg can take 1 hour of peaked bandwidth and just make it vanish when one looks at a weekly graph, while in netdata is most likely still visible.
as usual no right answer for anything lol
turtles all the way down…
I have onboarded few business clients. I would like to state this is most from “us” but I don’t know how many clients are out there and utilise the network in this very moment. There will be a small drop between 1-2 PB of data. If my clients be happy with the performance then there will be something a little bigger in range of 20-50PB. Will see. I can say this, be prepared to scale.
3 Likes
Nice to read that! Out of curiosity (without asking for details), what kind of data is this? Mostly cold storage? It’s a lot…
I’m also seeing a lot of ingress but little egress on my 2 nodes.
Currently between my 2 nodes on same computer 8TB and filling up very quickly hit 200gigs ingress yesterday.
yeah sounds a lot like my setup, just x2 which makes sense because i only have 1 node but i don’t plan on allowing it to fill, going to expand my array adding 30tb before i run out.
it’s kinda interesting actually that you say 200gb yesterday i got 230, which made me wonder why i got more, but i had like 1hr 20min downtime the day before so only got 64gb.
kinda makes me wonder if the about 30gb i was behind i got added on the 11th
which might indicate again that the satellites have made a decision about which node gets how much data and then has a plan to reach that point… ofc if there is data for it to store
and the node is like 5 weeks old
Well I can tell you why, Because my node is super old and running on a old dell Optiplex and it was hurting yesterday, 100% cpu useage all day probably garbage collection was running at the sametime I was getting alot of data. Also My node has been running since may last year. I can’t even load my dashboard right now thats how bad it has gotten. It has 5.2TB used currently.
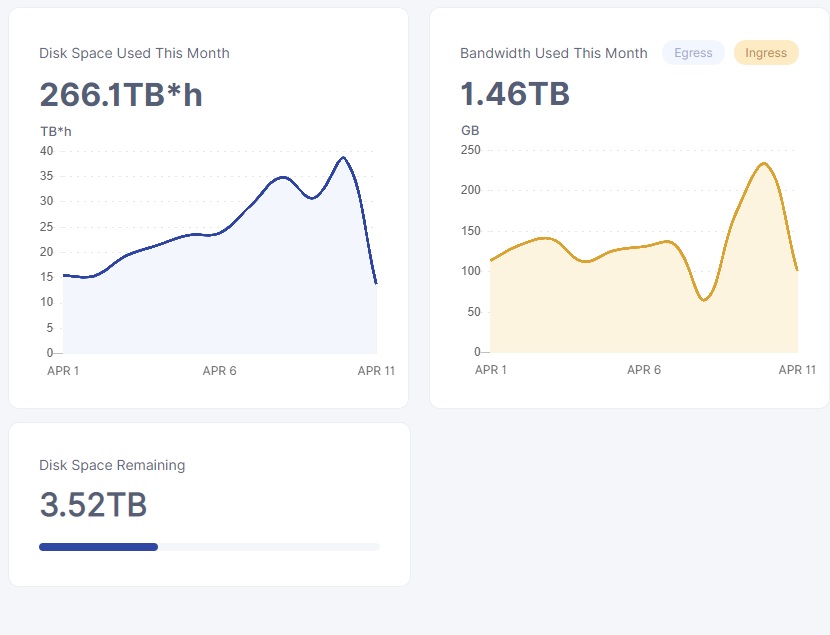
This is what it looks like right now

my server is really old, but fairly powerful even today, avg about 2% cpu utilization with spikes of maybe 5% old dual xeon x5630 which is 4 core 8 thread 2.1ghz i think maybe 2.3 doesn’t really matter they where the lowest wattage cpu i could get…
i don’t understand why your machine should use this massive an amount of cpu to service the node, unless if you are running antivirus scans on everything ingressing, or software raid, zfs compression… you know… something like that
seems really odd to me
my cpu’s are a decade old…basically processing power can be compared in threads and hertz
or its how i evaluate it these days…
if you know those two factors you basically can compare 1 cpu to another on the fly.
that outbound looks nice tho… doubt thats constant tho… xD
i barely avg ½mbit out atm maybe 1mbit out on a good day
This is running on ubuntu server no gui barebones, The cpu is from at least 2007 I believe and its a dual core. The outbound is actually pretty constant.
It’s all IO wait. Looks like the HDD isn’t keeping up. Not so much the CPU that’s the problem.
2 Likes
Yeah im thinking that, But I also think im getting hit with a garbage collection right now…
there is a setting for garbage collection in the config.yaml, more frequent runs might make it less of a lockup.
@BrightSilence now i feel stupid for missing it, i even thought about it before i wrote… lol
and i even use netdata myself… tho haven’t done so for to long.
so the cpu isn’t at 100% that is just an artifact of the disk io wait right?
Yeah he is right, cause when I use htop cpu is about 16% useage, I gotta do some upgradeing to move OS to a faster SSD. This dell is very limit of IO that can be used though…
Yep unfortunately it ends up still wasting those CPU cycles and it will impact CPU performance as the CPU cycles can’t be used while it’s waiting.
Guess I gotta pour more money into this machine, But its earned it, it was a free machine after all…