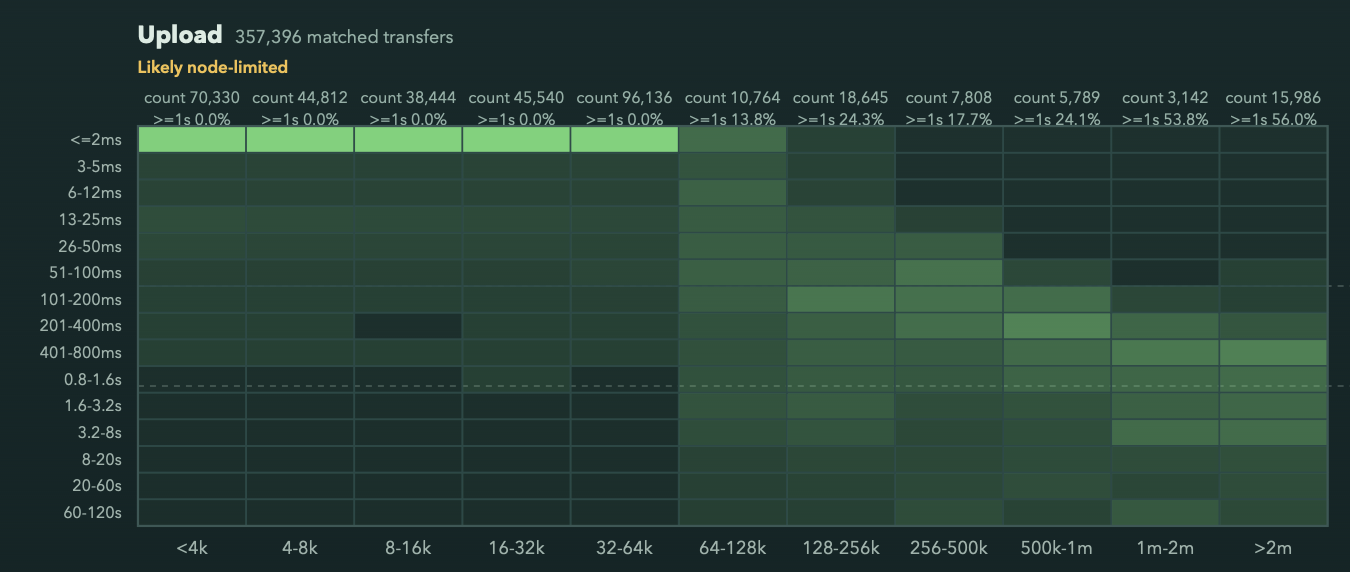
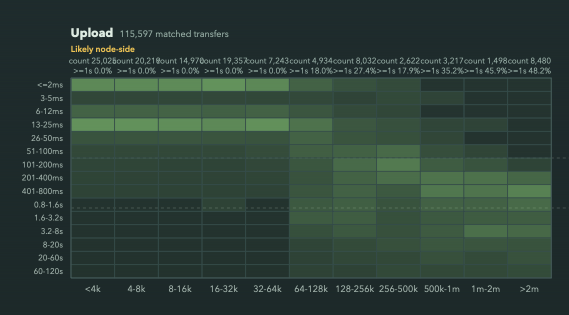
I’m observing a curious behavior in node upload path, where there is sharp cliff at 64KiB upload size performance (this node is connected to fiber gigabit internet):
There is no option to modify UploadBufferSize directly, but you can use these options to control how the memory is used:
$ uplink cp --help --advanced
...
    -p, --parallelism int                    Controls how many parallel parts to upload/download from a file (default 1)
        --parallelism-chunk-size Size        Set the size of the parts for parallelism, 0 means automatic adjustment
        --maximum-concurrent-pieces int      Maximum concurrent pieces to upload at once per part (default 300)
        --maximum-concurrent-segments int    Maximum concurrent segments to upload at once per part (default 10)
        --inmemory-erasure-coding            Keep erasure-coded pieces in-memory instead of writing them on the disk during upload
...
Right, but looks like most users use S3 gateway (based on observation that vast majority of traffic comes from/to very few IP addresses), and don’t have control over uplink config; and the rest – may not bother to tweak, assuming the default config must be optimal.
Maybe adjusting that at the s3 gateway level can improve S3 performance for essentially free – especially since gateway is already hosted on fast network, so there is very little reason to keep chunk size so small.
But at least the default value shall be re-evaluated.
Lol. Good question. TLDR: I was sick at home and bored out of my mind.
The graph shows time measured from “download started” to “downloaded” log messages as they are emitted by the node, and same for uploads.
It bothered me that I don’t understand the sharp behaviour change at 64k for uploads, (and minimum floor of 100ms for downloads, not shown here, which I understand the reason for)
There is nothing about it in storj code. But I found that is default chunk size in uplink code.
Yes.. I’m not saying "go set it to 3MiB on the satellite on Friday eventing, commit, deploy, and go home :). But I feel that in the modern times, even for native client, this tiny default transfer size may be unnecessarily limiting performance.
If so, I think a viable hypothesis would be that something within your home network buffers packets up to 64 kB per open connection and only then releases them to your node, and so they reach your node at exactly the same time.
Like, for example, could you check net.inet.tcp.recvspace in your sysctl.conf?
I agree, there could be some buffering, but it’s definitely not recvspace size:
That knob changes TCP receive-window / buffer sizing and sender backpressure; it is not a “buffer until 64 KiB then release to userland” threshold. Also net.inet.tcp.recvbuf_auto=1 is set, further blurring the boundary (it’s per connection though). Furthermore, this is a default/starting value, and application can override it – so if that was a problem, it still woudl have been on storj to correct it.
it is not a “buffer until 64 KiB then release to userland” threshold
Not saying it’s this. Rather, by the time storj code recognizes that this is an upload, 64 KiB worth of data has already accumulated, so already available for processing.
But your experiment shows it’s not it.
I’ve looked at the code. I agree with your assessment that this is likely coming from upload buffer size on the uplink side—the amount of data that gets into the first DRPC packet of the upload is decided by uplink, and only after receiving the full packet, “upload started” is logged. This actually means the log message is a bit late compared to just opening the TCP socket (or receiving the first UDP packet), and your measurements only start after the first DRPC packet is fully received.
As such, not sure if it makes sense to tune it—raising it will not actually make uploads faster, raising it will only hide more data from your measurements. Nagle’s algorithm, or whatever modern reinvention of it is in use, would be the right way of doing it.
And I think 64 KiB might be a decent trade-off. Why bother sending more if we risk that the upload will not be accepted (node checks this only after receiving a full DRPC packet) or be slow for this specific pair of uplink and node instances? Node might always decide not to allow the upload (e.g., maybe it hit the connection limit) or respond slowly (e.g., maybe it’s overloaded with traffic). Starting with a small amount of data, you allow the node to start handling the upload on its side early. Chunking by 64 KiB allows the last small chunk to be responded quickly to, so that the uplink side knows the upload is finished early, and drop other connections. So effectively it’s a trade-off between speed and upload overhead.
I guess it makes sense. But then it drags performance down for everyone – because those do accept can be done faster. Those who don’t – why shall be care abotu their performance? They would not accept our piece!
It’s not about performance of the node, but of uplink. Per V137.5 - high load? - #54 by littleskunk, it is opening 70 streams and waiting for 54 to finish. So the faster we bail out on the 16 slow ones, the less overhead in terms of wasted upload bandwidth there is for uploading on the uplink side.