I’m sure I’m not the only one that at first was a bit confused about the date roll in on the node and reflected in the dashboard falling at a different time than my local date roll. (I’m in US Eastern time zone.) I still have yet to look up what time zone the node/dashboard clock resides in, I just know it is based on a zone somewhere ahead of me.
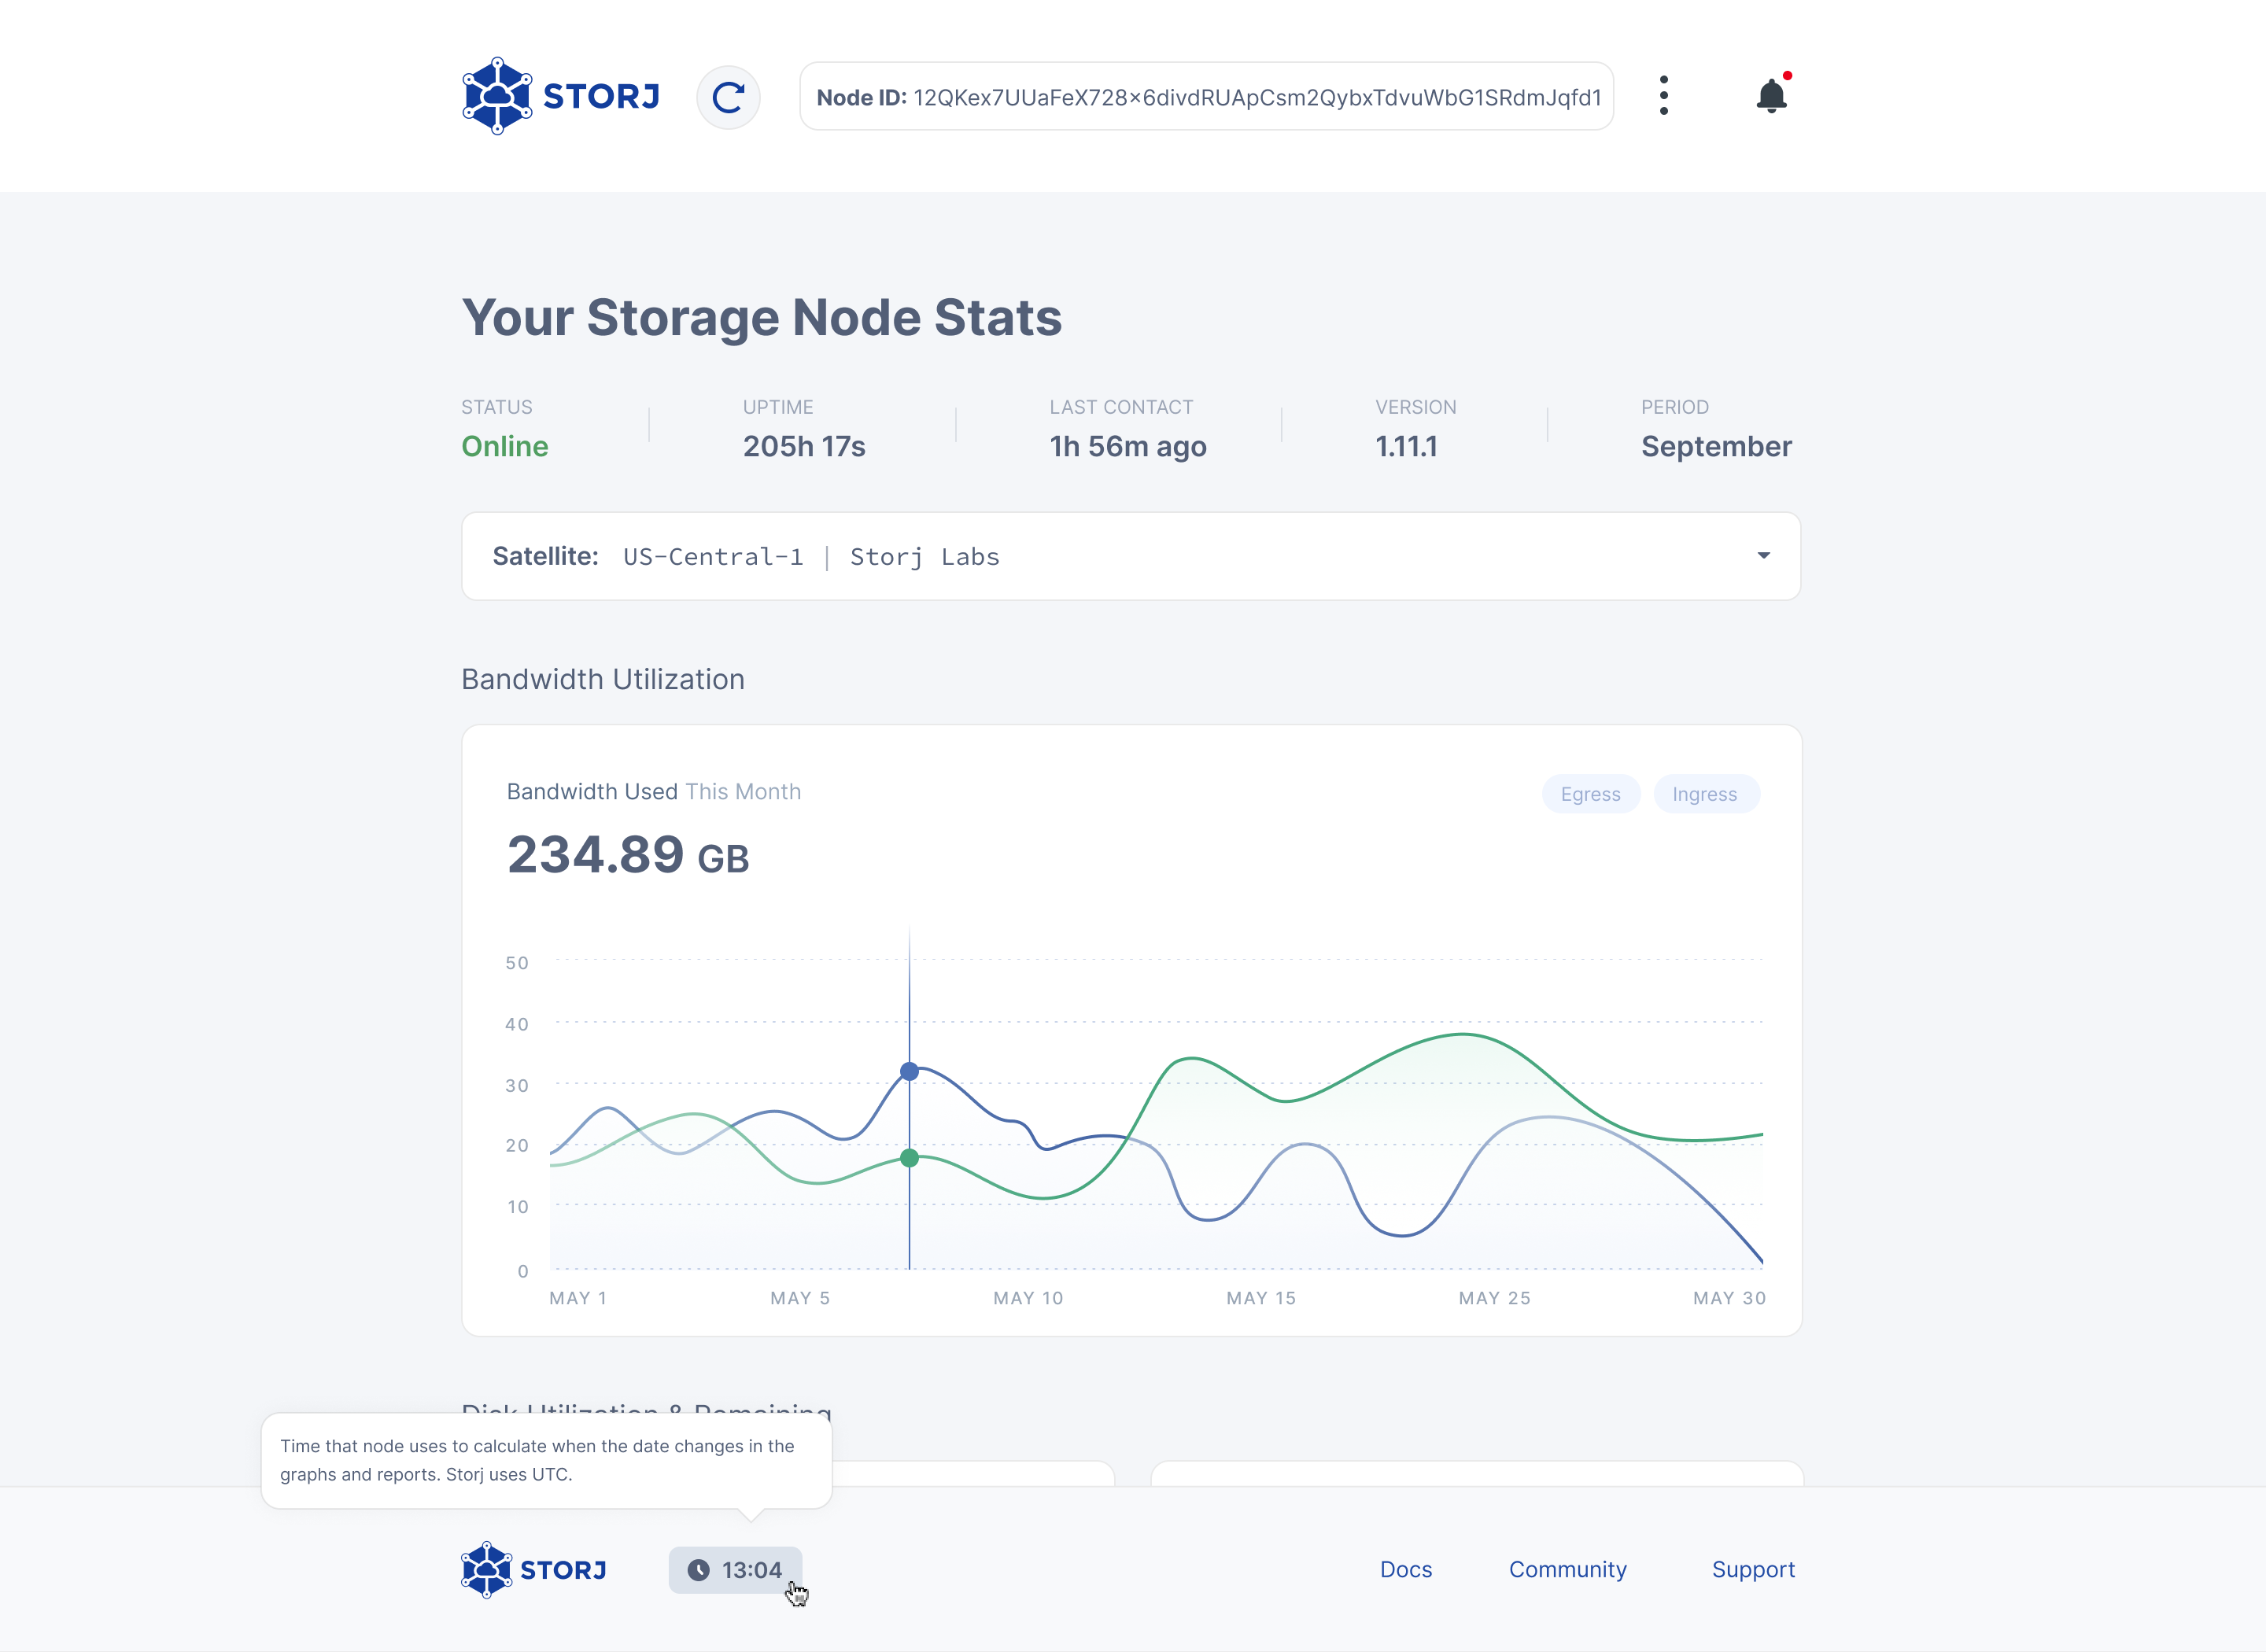
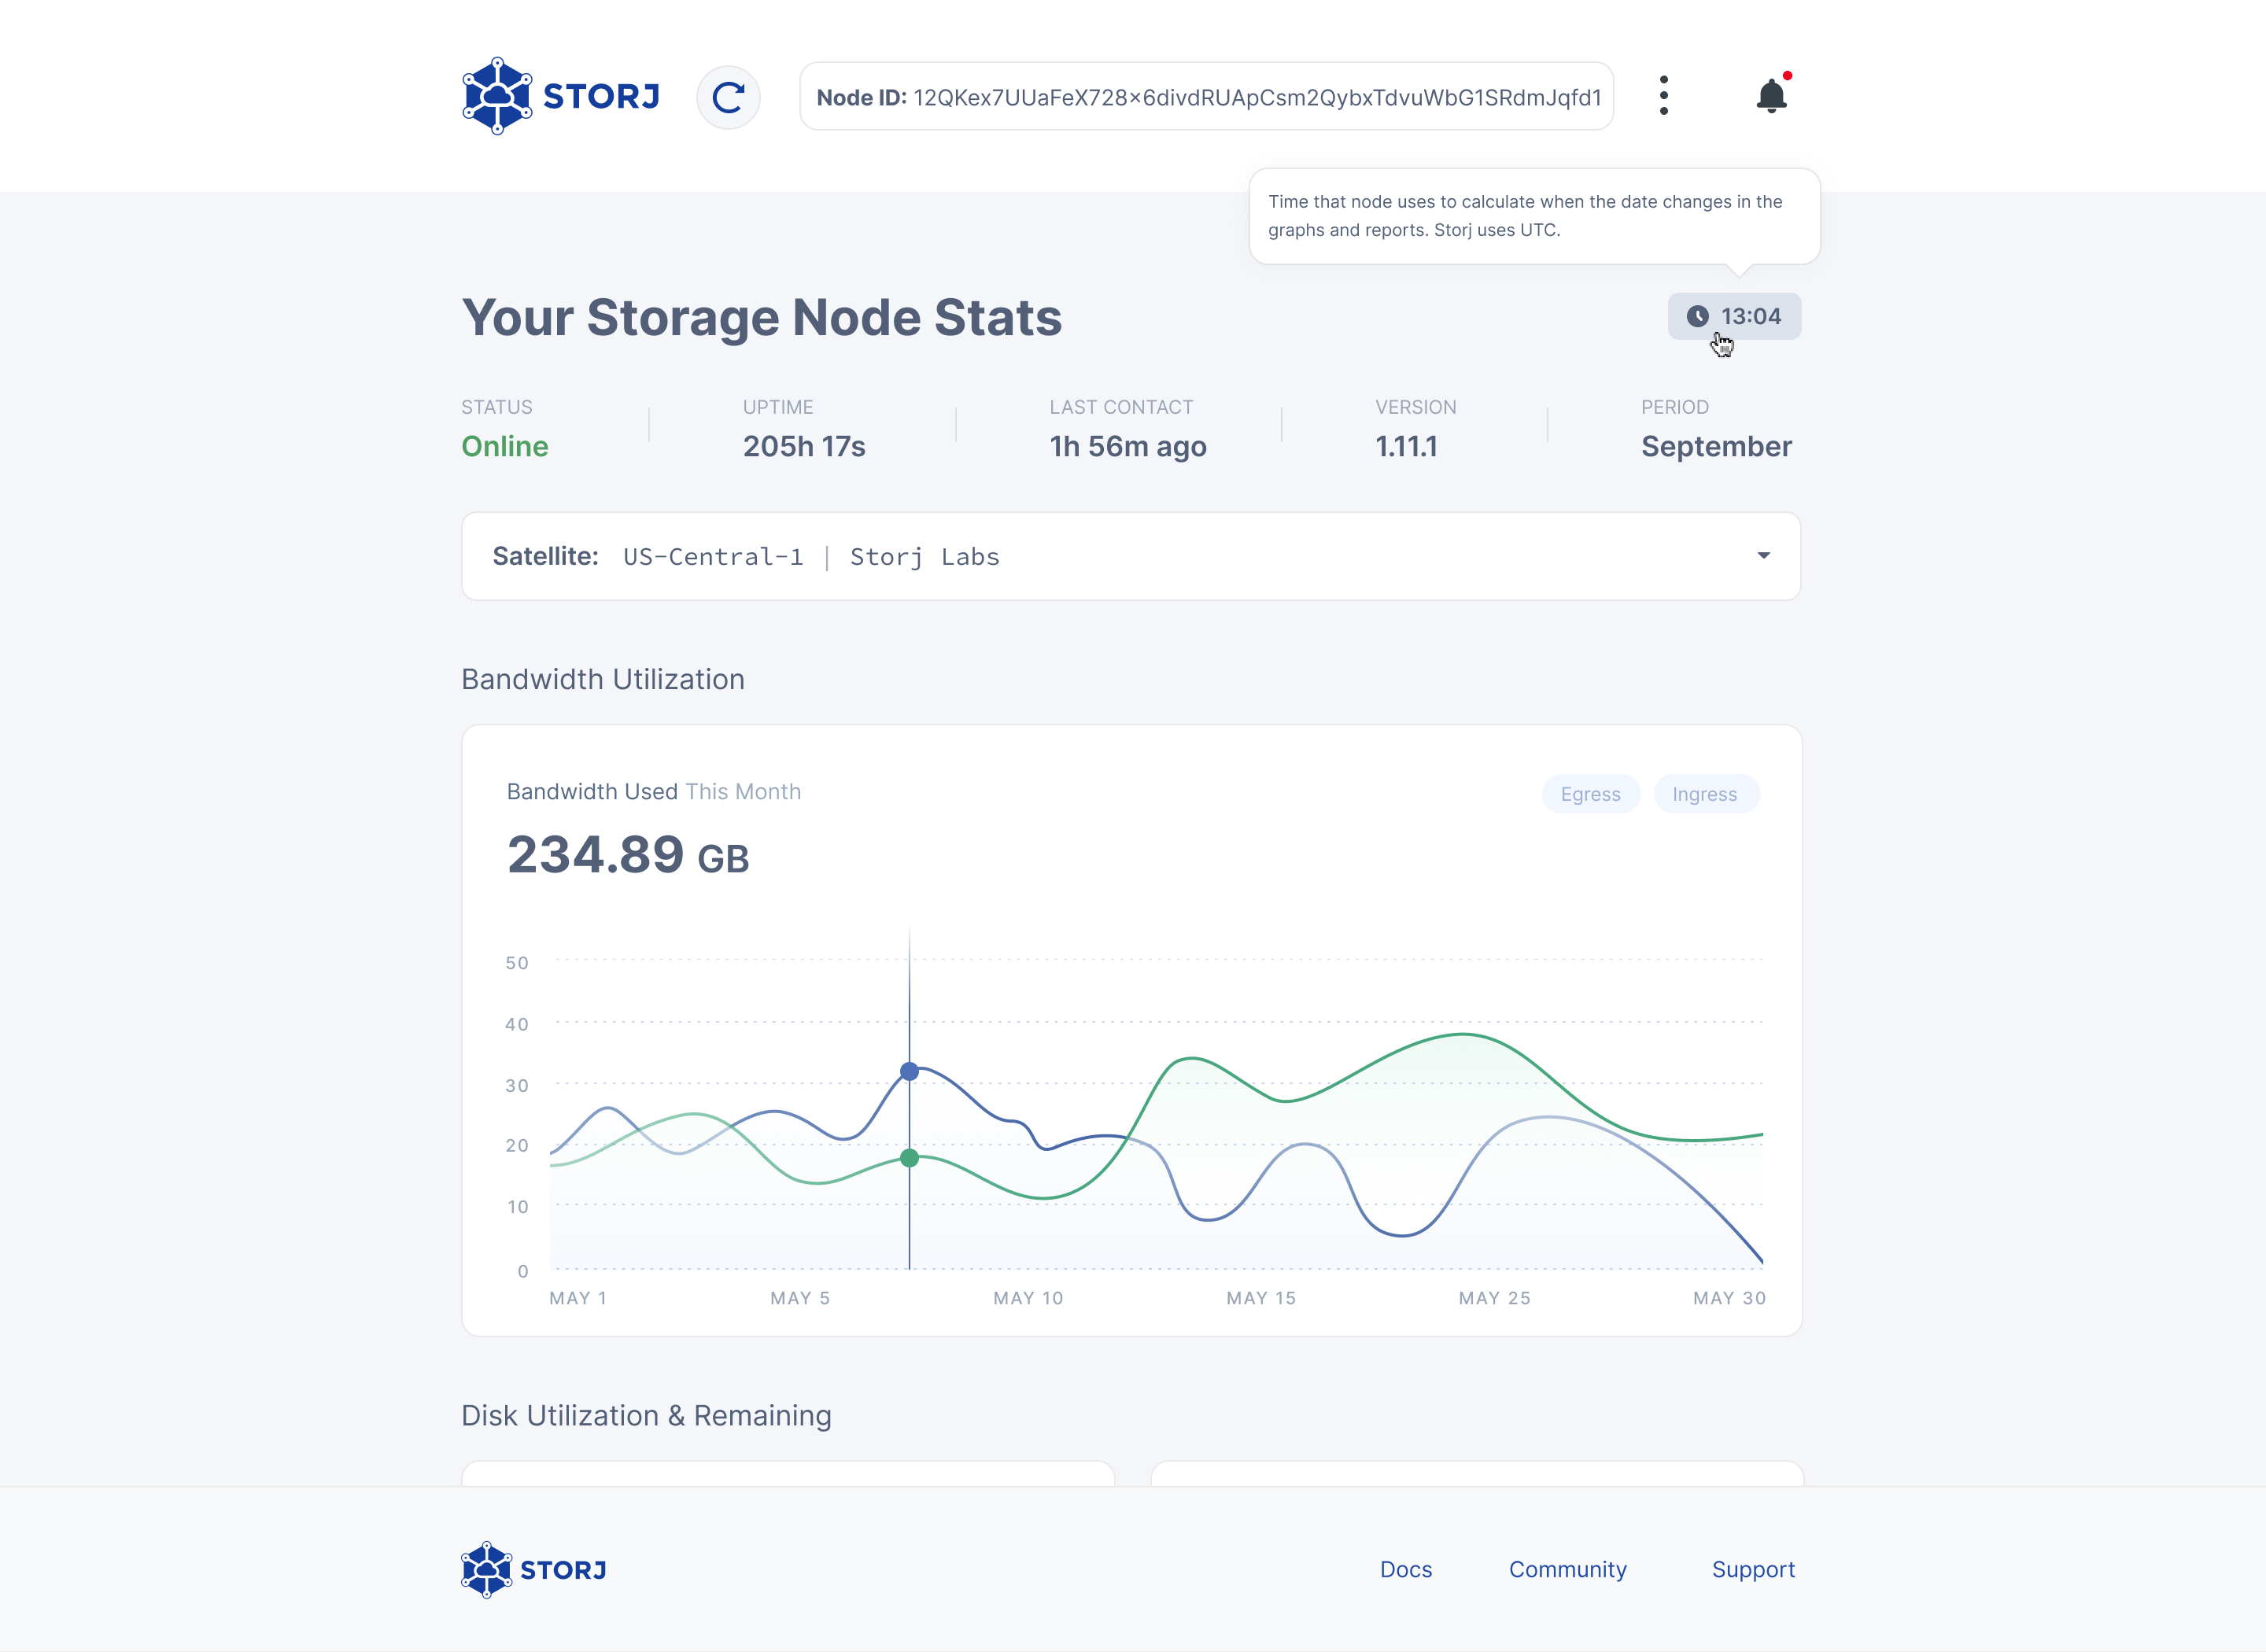
My suggestion is to add to the GUI dashboard display the current (network?) date and time that is being used in the reporting graphs. A mouseover tip could explain that this is not the current hardware or OS time in the host device, but the time that Storj node uses to calculate when the date changes in the graphs and reports. Maybe drop it in the middle of the footer?
A low priority request, but probably something stupid simple to implement since the “last contact” clock already exists and has timekeeping logic.
This probably would fit with what I’ve seen, but it would still be nice to have it in the dash. I guess at minimum, instead of the “network” time a note near one of the charts could be added indicating what time zone it uses.
it’s because that when the storagenode goes into the new day, it will do so on UTC.
so if you are 5 hours off, then it will start the day late or early.
for me it’s only an hour, but for you it should be like 5-7 hours ish
so at like 1900 or a bit earlier your node would switch to the new day in the graphs
maybe one could add an offset in the graphs… or something instead of a clock…
the clock idea isn’t bad tho, i kinda like it, just to sort of know what cycle the node is on… ofc most people won’t have a ton of use for it…
but it can be a bit confusing, especially with summer and winter time… so it drifts back and forth
but yeah my thought when seeing it initially was also like… WHY
Adding system time into a corner somewhere would be a nice touch, can’t hurt anything and isn’t hard to do. Should be in the same format/zone as the log entries.
yeah would be a small quality of life improvement mostly for new people, but it would still be there… and since it’s simple to do, it should be a given.
Or something that could be done by a first time developer, that wouldn’t affect the real code.
(and I want to say utterly stupid idea but then I’m in UTC lol)
You’d get used to UTC pretty quickly. In the Netherlands were already 2 hours off in summer. The sun is at its highest point at around 2PM. UTC would actually be a better traditional fit for us during summer.
But what’s the problem with just getting used to getting up at 18:00 and going to sleep at 10:00. We got used to a new currency in Europe and that was a whole lot more complicated a calculation than just adding or subtracting a few hours.
The benefit of timezones is that you can keep a comparable schedule without having to calculate the hours. Like get up at 6am every morning and get home at 4pm. If there’s UTC everywhere and I travel, I suddenly have to get up at 6PM and come home at 4AM? That’s quite uncomfortable… Better to just change my clock to add a few hours.
I didn’t mean it like a universal time but more like your inner clock and what you are used to. You might easily add a few hours to your normal routine but if you move to another country and have to add 10 hours to your routine, you’d always be like “normally I eat lunch at 12, so here I have to eat it at 22”… But maybe that’s just me I just think humans love their routine and things they got used to.
just add a UTC hour hand to the local time clocks, not that complicated…
then you can tell time between two timezones easily, without any real knowledge required…
if the extra hand is like color code or something to make it obvious its not the real hour hand.
makes the most sense, because it’s when the new day starts on the Bandwidth Utilization graph, that can be a bit confusing since for some people it’s many hours off and thus when the new day starts the storagenode still looks to be in yesterday.
tho in the footer could also work, but ends up being a bit out of view and further away from what it’s suppose to help explain.
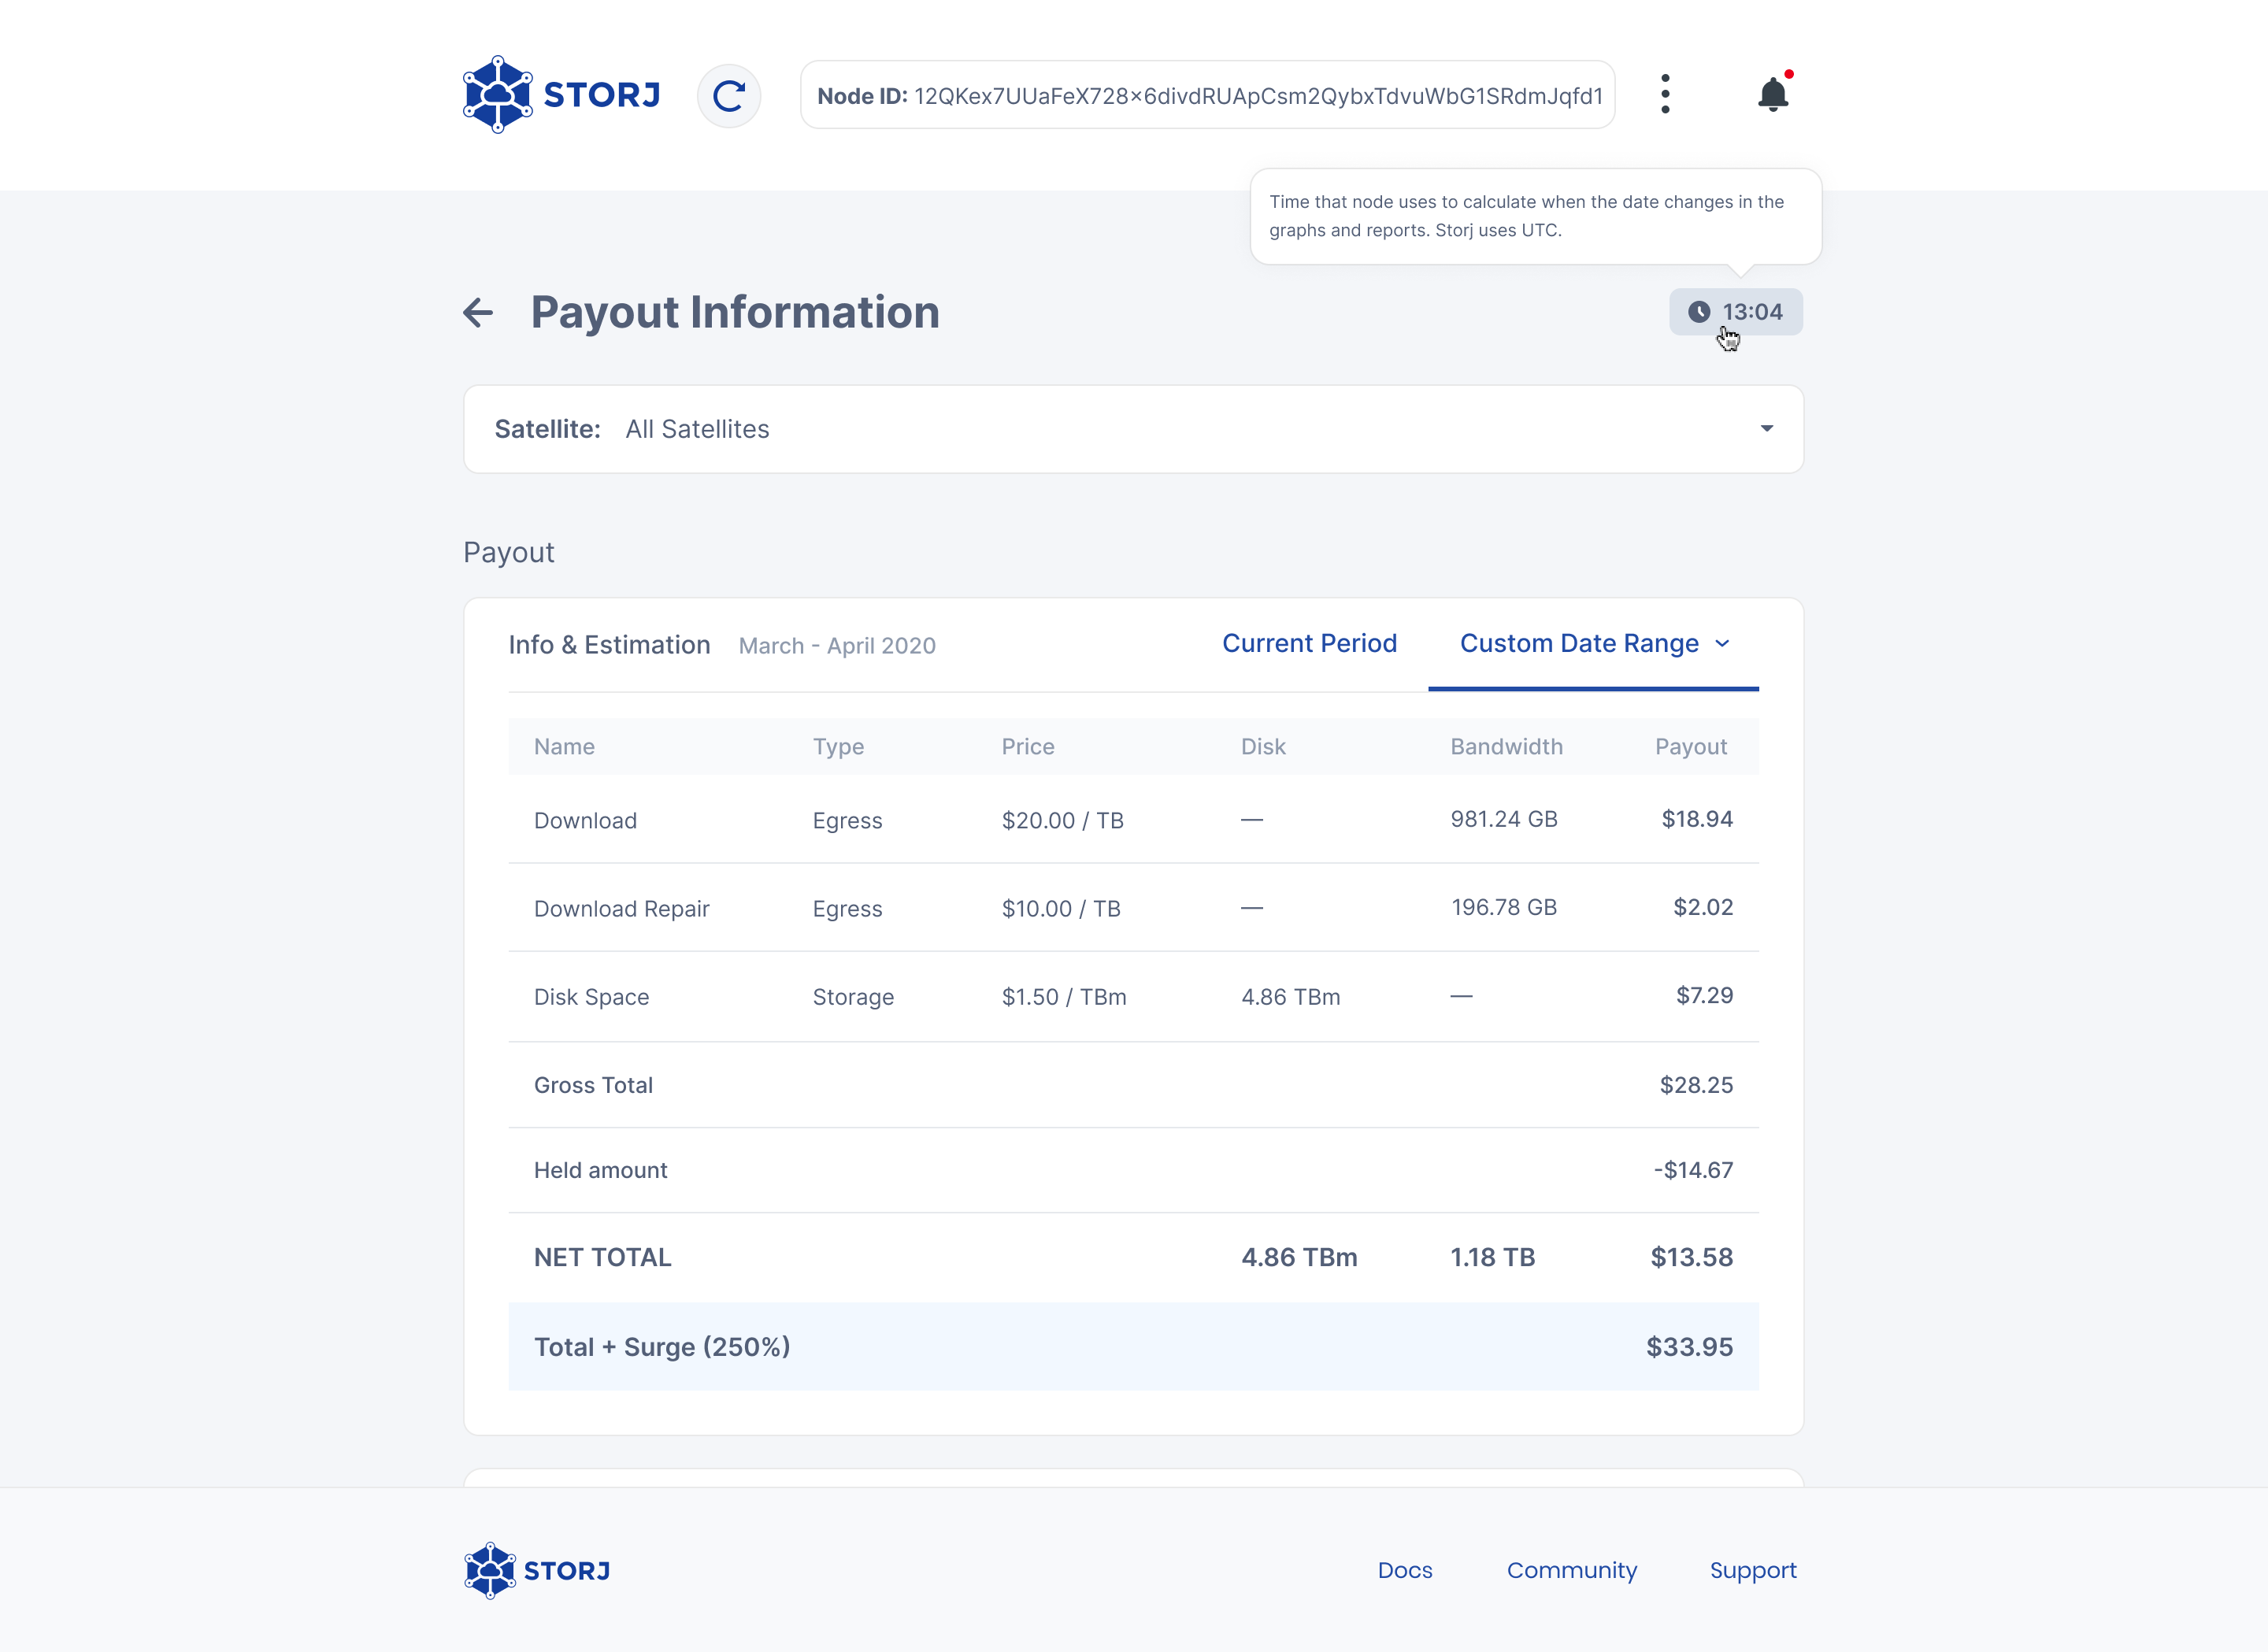
@Stob might be right that in the header or footer it would be visible from all locations when using the dashboard, thus whatever current or future additions that may be aided or explained by the storagenode time.