I run multiple nodes. All of them seam to be off for the calculation of the two mentioned values by a big factor (that can not be described by deleted files).
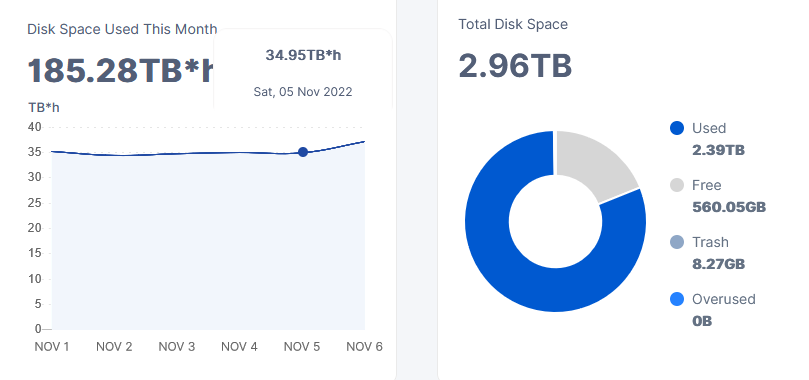
e.g. I have one node with approx 2TB since beginning of the month → what I would expect is at least 2*24=48TBh per day → however, I received a maximum of 35TBh for yesterday
Is there a problem with the calculation?
The same is true for “Disk Average Month” → which is directly related to my payout!!
Here I would expect at least 6 days x 2TB x 24h = 288TBh → as a month has 720h (30days x 24h) → this would mean that I should at least have (288TBh / 720h/m) 0.4TBm = 409GBm
however, my dashboard only shows 293GBm
could anyone please explain the discrepancy or how to correctly calculate this → at the moment I have the impression that the dashboard shows wrong values → I have not checked yet if the values are re-calculated for the payout at the end of the month…
The value in TBh is received from the satellites, the value calculated as Used (on the right side) in TB - is calculated by the node.
Could you please calculate used space in the blobs subfolder (replace the path to yours)?
du --apparent-size --si -s /mnt/storagenode/storage/blobs
thx for your reply. The calculation for du … for the node as above takes quite some time. In the meantime i can show you the results for a second node … sorry for the small image but as a newbie it seams that i am only allowed one image per post …
Also on this node, the math does not work out:
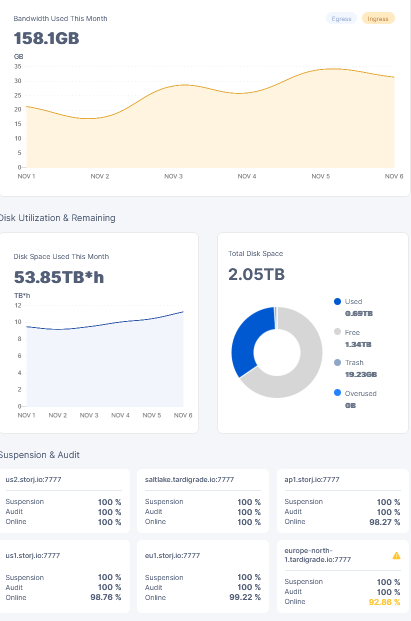
ingress data = 158GB → used 0.69TB
output from
du --apparent-size --si -s storage/blobs/
690G storage/blobs/
(so equal to used)
uptime as you can see on the image between 92 -whyever - specially as this node is in europe?? and 100%
Also in this case - let’s calculate the worst case data:
current used data: 690GB - the ingress for this month: 158GB → minimum should be 532GB if there would be deletions - even more …
I should receive at least 12.46TBh per day and the best full day was yesterday with 10.45TBh
The calculation for the other system (from the first post) is ready now …
uptime: 89% to 94%
du --apparent-size --si -s storage/blobs/
2.4T storage/blobs/
which is also exactly the same as the “used” space on the dashboard
Not all ingress will end as stored data, some will be canceled during upload, some will be deleted after upload. So you cannot use an ingress as a measurement what is stored right now. The TBh there for exactly this reason - the stored amount is accounted every hour, like electricity in kWh, because data comes, deleted and stored during the time.
Since your node have had a downtime (the online score is not 100%), some delete requests may be missed by your node, so the garbage collector should remove this data some time later. During this time you will have a discrepancy between what your node should store accordingly information from the satellites and what it is actually stores.
@Alexey ,
I am afriad, the online score is not the reason, I have another node with 100% uptime and the same discrepancy!
in this case, i have todays ingress of 5GB → used yesterday should have been at least 90GB → should give at least 2TBh for yesterday - is 1.3TBh → with 100% uptime!!
the discrepancy is present on all nodes - however so far I didn’t calculate if it is an equal percentage or whatever … - What I can tell for sure is that it is independend from the uptime
This would have been interesting to find out. Unfortunately I cannot find out, what the “used” space for an individual satellite is. I can only obtain my totally used space - not how much oft his space came from a specific satellite.
Question to the audience, is this a common observation or is that somehow unusual in my setup?
I would be interested, how many had similar observations …
@andrew2.hart
I did further investigations and tried to estimate the space on disk based on the directories in my storage directory … my findings:
Satellite
Space on disk
Disk used based on
expected
discrepancy
Discrepancy
du …
Dashboard
[MBh]
[MBh]
[%]
us2.storj
7,5MB
161,13MBh
180
18,87
10,48
saltlake.tardigrade
774MB
15,03GBh
18576
3185,28
17,15
ap1.storj
12GB
147,06GBh
288000
137410,56
47,71
us1.storj
49GB
0,68TBh
1176000
479680
40,79
eu1.storj
48GB
627,07GBh
1152000
509880,32
44,26
europe-north-1.tardigrade
632MB
13,01GBh
15168
1845,76
12,17
used formulas:
expected = Space on disk [MB] * 24 - (in case of GB also *1000)
discrepancy = expected - space according to dashboard (GB factor 1024) → to be conservative
discrepancy [%] = 100/expected * discrepancy
Ingress is not equal to stored, you need to account deletions and do not account the cancelled transfers.
You may compare only used in TBh and used space on the disk. If there is a discrepancy, then your node missed deletion messages and this data will be removed by the Garbage Collector later.
All Storj software uses SI measure items, it’s base 10, not 2. So 1GB ~ 0.9313225746154785 GiB
in my calculations I always calculated pessimistic - in favour of the values from the dashboard)
If this discrepancy can be solved with the garbage collector, how can I execute this?
As you can see, I always calculate in favour of the dashboard (i subtracted the whole transfer including possible cancelled transfer and valid input … what I calculate is a pessimistic best case!)
having a discrepancy of 40% on a node with 100% online score is somehow strange. This sounds like an implementation error - too many chunks seam to be transmitted unfinished (or that 40% of my storage is used without beeing paid for) .
What I wonder - is this only with my nodes? Is the math correct for your nodes? @Alexey@andrew2.hart ?
I am already heaving the discrepancy in the daily calculations, however it seams that they are closer with Alexey …
maybe it is correct that this is only an garbage collector issue and will solve itself soon … still should be handled / visualized better in a professional product