its a know bug? on 1.53.1. You can try change theme to “light/dark mode”
Indeed, a known bug and current thread is here:
1 Like
That worked but I can not see how to change it back to light mode.
It’s the same button. The three vertical dots to the left of the bell icon in the top row.
1 Like
Already tried that. Nothing for light mode. Tried setting>appearence>classic blue but it just opens a new tab and does not change the dashboard.
@mdmeyerpfa I thought you were referring to the web UI. I don’t know what program you are using, sorry.
You had it right. I’m using Chrome to display the Storage node dashboard at Localhost: 14002. on Windows 10 Web UI version 1.54.2.
Edit: fixed it. had to reset browse to default settings
i am on 1.54.2 and seems not fixed (e.g. works only if change theme), tested ton chrome/firefox
Hi everyone we are currently working on a fix!
EDIT (May 17, 2022)- After speaking with the team, the issue is that the filter options don’t work, currently we are only able to show combined ingress and egress graphs. Simply refreshing or switching between light and dark mode just shows the combined graphs again. AFAIK this is just a visual bug and not seeing ingress or egress graphs separately shouldn’t be a glaring issue for storage node operators. This also means that at the moment this isn’t a high priority bug, we hope everyone understands!
8 Likes
Problem exists since 1.53.1 and still in 1.54.2. I’m really looking forward to a solution ![]()
Affected version:
1.55.1
Problem description:
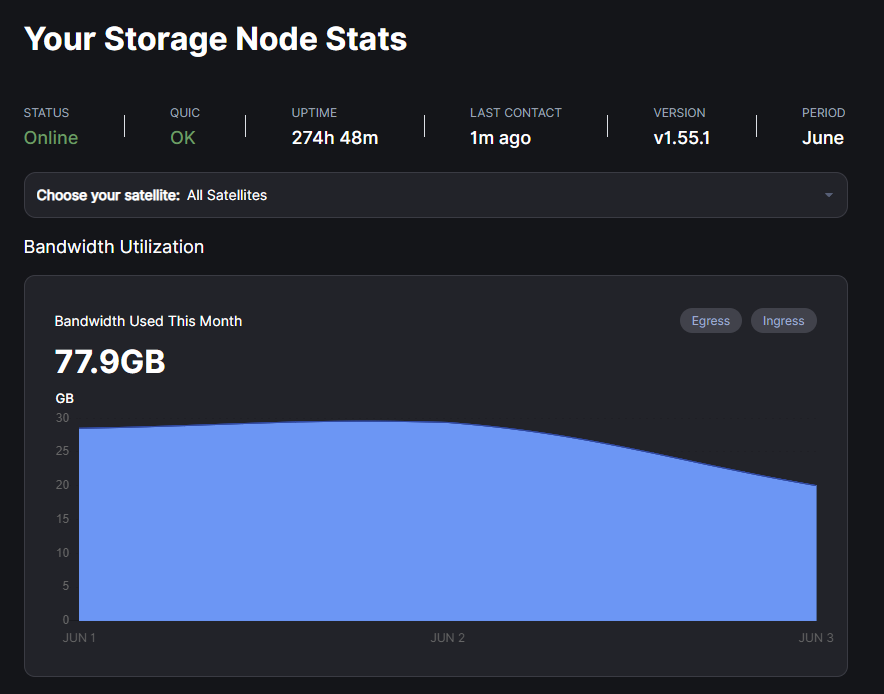
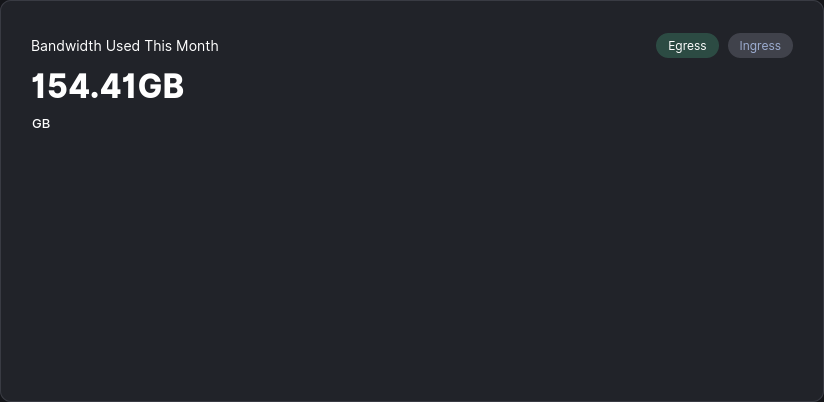
When laoding the Web Dashboard the graph “Bandwidth Used This Month” showing the total bandwith of the current month.
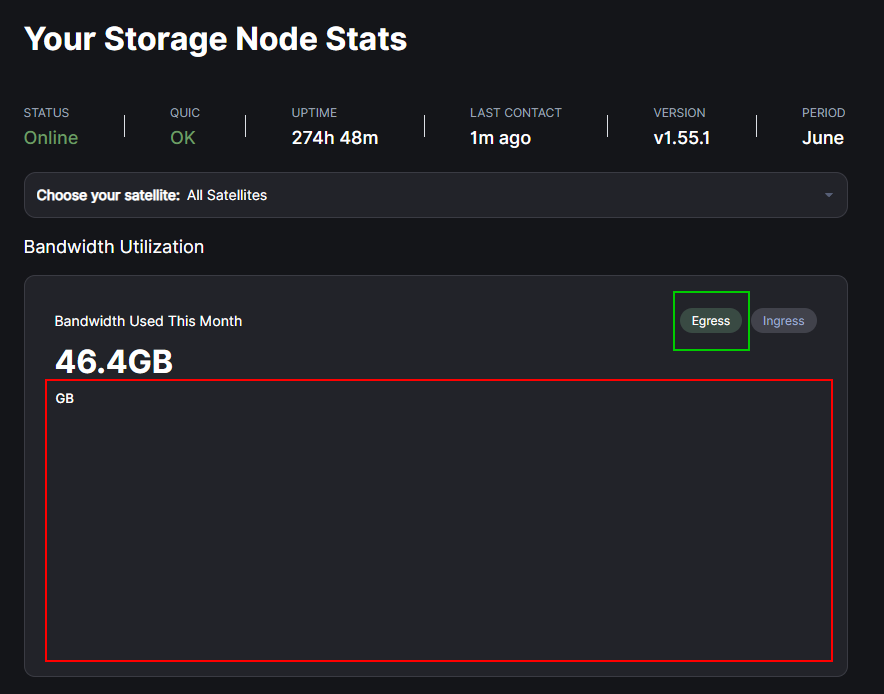
But when pressing the button either “Egress” or “Ingress” the graph will disappear.
After toggeling the buttons, the total amount will not show again.
Only a refresh of the page will show again the total bandwidth.
The same behavior with Microsoft Edge and Firefox Browser.
Yeah its a bug. I think changing from dark to light mode fixes it temporarily
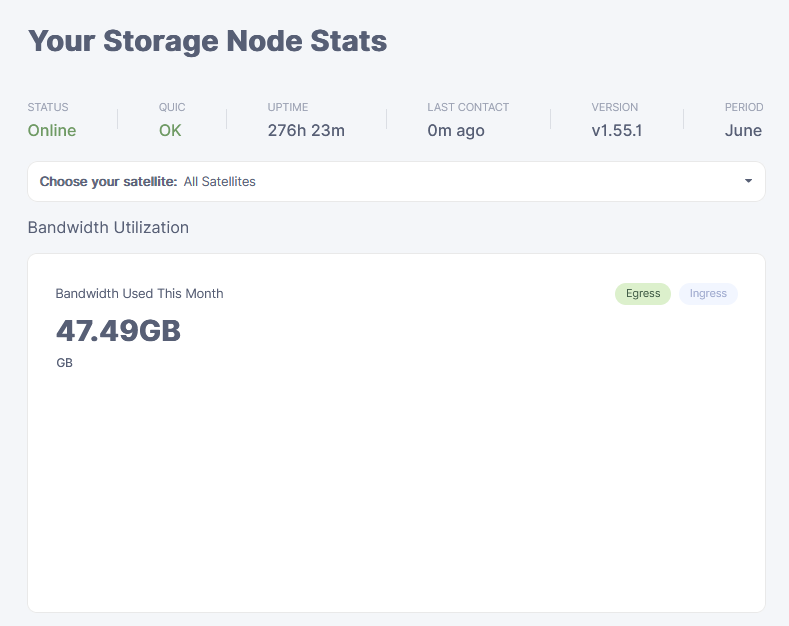
This is a different bug but could be linked. Same version on my node and this also occurs, tried Ctrl+F5 but Egress and Ingress buttons hide the graph.
As title says.
Before click
After clicking Ingress
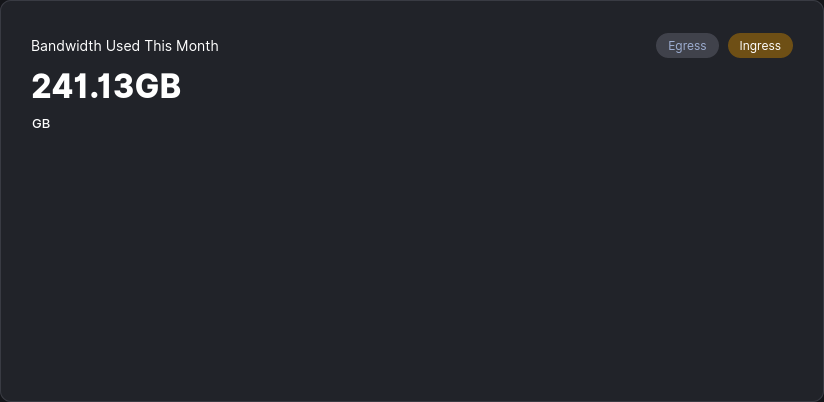
After clicking Egress
Reload button not helping
![]()
Refresh page restores the graphic, but for both IO processes only. Looking forward to seeing the new version…
2 Likes
v1.56.4
Not fixed yet
1 Like
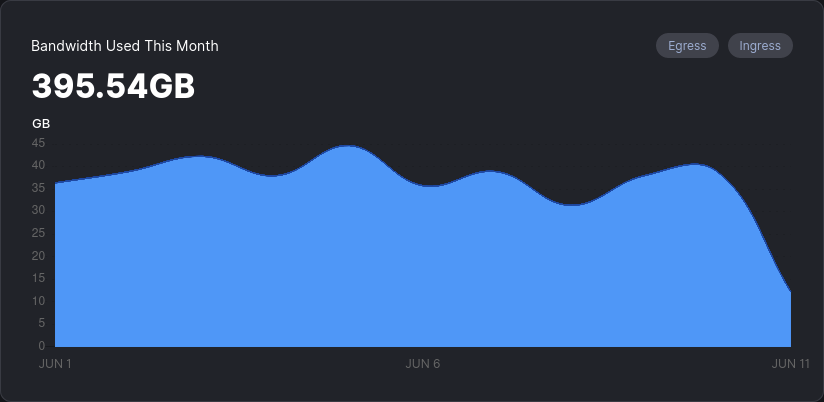
Any chance we could get this chart changed to show ingress and egress as lines? As a node operator I want to see the days ingress exceeds egress as this suggests more disk usage. Having the ability to quickly see that “most days” ingress exceeds egress lets me know the node is still growing, and so is my payout.
Speaking of this - it would really be great to have a graph to show node operators disk utilization over time with a 90 day forecast (understanding there are no guarantees) - this would help us plan storage increases that are timely, as well as help us predict the time it might take to decommission a node.
1 Like
V.1.59.1 already - really insignificant bug which no sense to correct ![]()
2 Likes
issue still on 1.61.1…
Since 1.53.1 upto 1.64.1 not fixed yet. Almost half year bug exist. Terrible.
1 Like