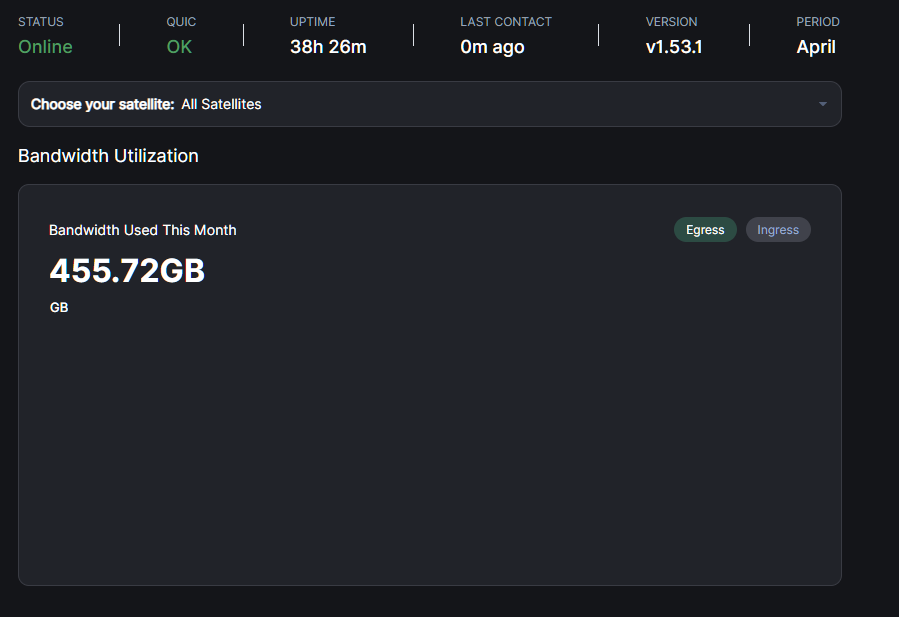
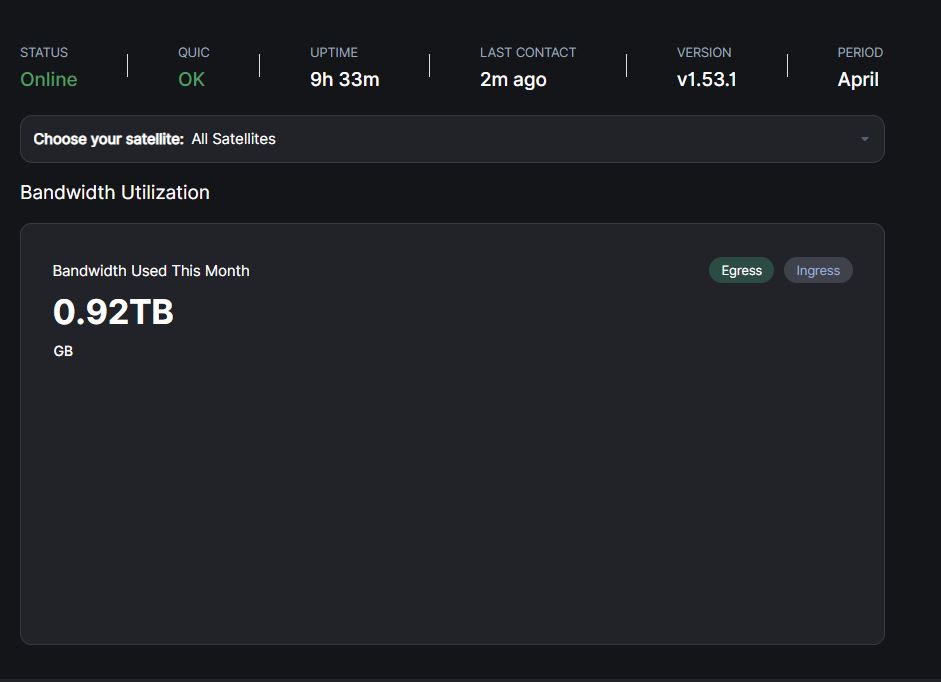
When I checked my node dashboard today the total bandwidth utilization was displaying correctly but the graph was blank when selecting either Ingress or Egress for display. This is the first day that I have checked the dashboard while running version 1.53.1.
I tried using a different browser (Chrome) and the blank issue persisted in addition to the Disk Utilization & Remaining graph being displayed across the page and not scaled correctly.
@SGC Is your graph still ok if you select the “Egress” or “Ingress” button? I have stopped and started the node with the same result. No fatal or malformed errors in the logs and still showing steady ingress during the day, 100% online.
I am attaching a screenshot of the new version of a node that has been updated today. When you change the view in the dashboard to see only the egress or only the ingress, the graph is not displayed. This happens for all of my seven nodes and even restarting the node and updating with ctrl + f5 doesn’t change. Also tested with other browsers (edge, ie, firefox, chrome).
I ask whoever is competent to do a check.
Thank you very much
have same here, total bandwidth is shown, but is i watch Egress or ingress only then show nothing. To be true this not really a thing for me, don’t use them.
Both my nodes are behind a single IP, not sure when this week it happened but both suddenly lost their graph on the dashboard for Ingress & Egress… When you refresh the page the Monthly usage graph shows but soon as you click on any of the two buttons for Ingress or Egress it shows the total not the graph. Does anyone know how to fix it?