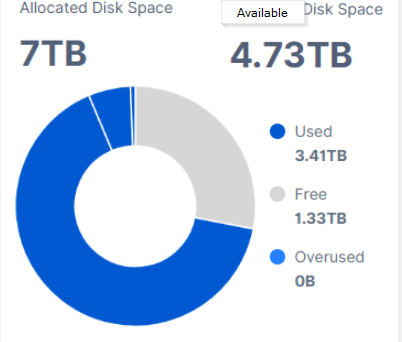
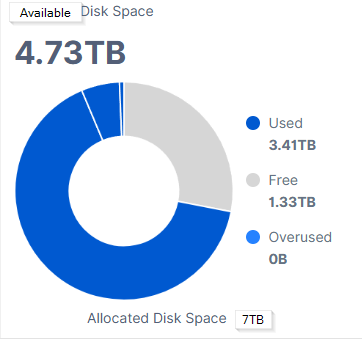
What measure units? Binary (base 2) or decimal (base 10)?
However, doesn’t matter. The working hypothesis that it now again pop-up the (available + total used) as allocated in the UI.
Do you have a string in the logs after that node start where it say that “less than allocated”.
Yes, I do, but doesn’t that kind of contradict the whole point of allocating storage? Sure, the drive could fill up, but that’s what the “safety mechanism” is for—it stops new data from being written once the drive reaches less than x GB.
I have a total of 136 TB for Storj, but after the update, it now only shows 100 TB.
I understand the reasoning, but I think it’s an unfortunate solution because the allocated storage should remain the same—the free storage should adjust accordingly, not the allocated storage. Just my opinion.
2026-06-12T10:35:18+02:00 WARN Disk space is less than requested. Allocated space is {"process": "storagenode", "bytes": 14152692255616}
What we’ve had for years is a UI with a label for “Allocated Disk Space”… that showed the static size we allocated. Everybody understood it.
Now we have a UI that’s showing a variable “Available Disk Space” number… but that’s still calling it “Allocated Disk Space”. We can learn what the new number is… but today it’s causing confusion
Edit: And although it would have been trivial to add a new API name for the new number… you recycled the same “allocated” API field but changed it to a completely different calculation. Every API-based report broke
I would expect—or rather, I would like—it to work like a hypervisor. There, I can allocate more RAM, CPU, and storage than I actually have, though of course there’s a risk of it crashing. In the case of Storj, however, I gradually delete Chia pots to ensure I always have enough storage, and I’ve only allocated 16 TB of my 18 TB HDD.
As it stands now, the allocation only makes sense if you want to allocate less Storj than the disk’s capacity.
You both didn’t answer the direct question, what do you expect to see on the dashboard, when you have specified 16TB as allocated, but in the reality you have only 14.15TB? with your numbers please, like 6.46TB used, 263.15GB trash, 919.74GB reclaimable. Where excess externally used 1.85TB would go?
I would expect the UI to show me I have 16TB Allocated, and 14.15TB Available.
Alexey: Seriously, personally, what would you expect?
Allocation was a cap the node wouldn’t exceed. And, that didn’t change: it’s still a cap the node won’t exceed. So why did a number in the UI labelled “allocated”… change?
We tried two options - either reduce a free space in the allocation, then the node reported as full on the edge or even overusage, now seems we are trying to reduce the allocation instead…
Seems another category as “externally used” is needed (in the allocation )..
Rename it to Available? But it will be confused with “free space in the allocation/available”…
If you also factor in the “Average Disk Space Used This Month” metric, it’s a complete mess…
I would say, let’s reduce the allocation, it will be fair. You deleted something - restart the node to update the available (and a free space in that available).
I think the UI should only display the node data.
I have 16 TB allocated, of which 5 TB is data, 0.5 TB is trash, and 1 TB is reclaimable, so in this case there is still 9.5 TB free.
At most, just a new value in the UI AND in the API that shows the free space according to the OS.
Actually, I’m only interested in the node data in the UI, not the OS data.
Edit:
But please make sure the “Allocated” value in the API matches the value entered in STORAGE, since that is the storage I’ve allocated for storj.
This is off-topic: but I’ve seen more questions about that metric than any other. Who finds it useful? It’s labelled as an average: but people treat it as if they expect it to be a sequence of Used-Space numbers. And few realize it comes from Satellite data… which isn’t always reliable… so can have holes in it… so when those holes appear they post here.
I’d swap it to be just a time-series of the last 30-days of “Used”. Simple, it’s easy to see if your node is using more/less space over time, and can be done without talking to the satellite.
not 9.5TB free but 7.65TB, because 1.85TB is occupied by something else. If there is an edge case, like if you have only 6.5TB of actually available for allocation, but claiming 16TB, then the picture would be like:
Allocated 16TB
Used 5TB
Trash 0.5TB
Reclaimable 1TB
Free 9.5TB (but actually - 0TB, because 9.5TB is used by something else).
I’m not quite sure what you’re talking about—is this based on node or satellite metrics? The initial plan was to show the “satellite side,” but it wasn’t expected to take more than 24 hours on the satellite side…
You wanted to know what we think the UI should display—that’s what we meant.
I’m not interested in what else is on the HDD in the UI; I just want to see the node values there. “Free” in the sense of space still available for the node, as opposed to “allocated.”
Then, if necessary, an additional field like the one Rexor showed, where the OS’s free space is displayed.
In this context, how much of the memory allocated to the node is still free? Yes, I just want to see the node data.
For those who still have other data on the HDD, as Rexor showed, you can also add a field that displays the free space reported by the OS.
Then I’ll know exactly how much space the node still has—minus trash and reclaimable space—and how much the OS reports as free space.
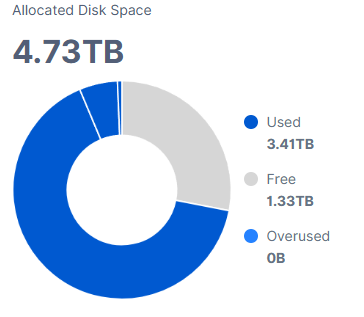

 )..
)..