Disk usage discrepancy?

Ok i understood you, it represents how much data totally stored (reported by sat). Thx for clearing that question for me.

But, if graph show something else, rather than “Average Disk Space Used This Month” - there obviously should be another caption for this graph.

These are unrelated activities. You can change the database location, moving databases to that location, it requires to restart the node. The MND will show the result, handled by storagenode in question (via their API).

Having a hard time following the thread, but basically my dashboard is saying 12tb. my OS says 19tb is used. My file walkers finished, I think?

2024-06-19T23:04:27Z	INFO	lazyfilewalker.trash-cleanup-filewalker.subprocess	trash-filewalker completed	{"Process": "storagenode", "satelliteID": "12L9ZFwhzVpuEKMUNUqkaTLGzwY9G24tbiigLiXpmZWKwmcNDDs", "Process": "storagenode", "bytesDeleted": 0, "numKeysDeleted": 0}
2024-06-19T23:04:27Z	INFO	lazyfilewalker.trash-cleanup-filewalker	subprocess finished successfully	{"Process": "storagenode", "satelliteID": "12L9ZFwhzVpuEKMUNUqkaTLGzwY9G24tbiigLiXpmZWKwmcNDDs"}


2024-06-19T23:04:27Z	INFO	lazyfilewalker.trash-cleanup-filewalker.subprocess	trash-filewalker completed	{"Process": "storagenode", "satelliteID": "121RTSDpyNZVcEU84Ticf2L1ntiuUimbWgfATz21tuvgk3vzoA6", "bytesDeleted": 0, "numKeysDeleted": 0, "Process": "storagenode"}
2024-06-19T23:04:27Z	INFO	lazyfilewalker.trash-cleanup-filewalker	subprocess finished successfully	{"Process": "storagenode", "satelliteID": "121RTSDpyNZVcEU84Ticf2L1ntiuUimbWgfATz21tuvgk3vzoA6"}


2024-06-19T23:04:27Z	INFO	lazyfilewalker.trash-cleanup-filewalker.subprocess	trash-filewalker completed	{"Process": "storagenode", "satelliteID": "1wFTAgs9DP5RSnCqKV1eLf6N9wtk4EAtmN5DpSxcs8EjT69tGE", "Process": "storagenode", "bytesDeleted": 0, "numKeysDeleted": 0}
2024-06-19T23:04:27Z	INFO	lazyfilewalker.trash-cleanup-filewalker	subprocess finished successfully	{"Process": "storagenode", "satelliteID": "1wFTAgs9DP5RSnCqKV1eLf6N9wtk4EAtmN5DpSxcs8EjT69tGE"}

2024-06-19T23:04:28Z	INFO	lazyfilewalker.trash-cleanup-filewalker.subprocess	trash-filewalker completed	{"Process": "storagenode", "satelliteID": "12EayRS2V1kEsWESU9QMRseFhdxYxKicsiFmxrsLZHeLUtdps3S", "Process": "storagenode", "bytesDeleted": 0, "numKeysDeleted": 0}
2024-06-19T23:04:28Z	INFO	lazyfilewalker.trash-cleanup-filewalker	subprocess finished successfully	{"Process": "storagenode", "satelliteID": "12EayRS2V1kEsWESU9QMRseFhdxYxKicsiFmxrsLZHeLUtdps3S"}


A post was split to a new topic: Multinode dashboard shows a different used space than the single node dashboard

Hallo - i have a few disks where the stats looks like this:

but in windows i see:
image

so windows says i got plenty of space - storj dashboard says i have overused space.
in the config the size is 8.2TB

all nodes are version 1.105.4
this is on multible nodes.
File system is NTFS
Large CMR drives.

on another node in the same system (also NTFS drive - CMR - newest update)
it looks like this:

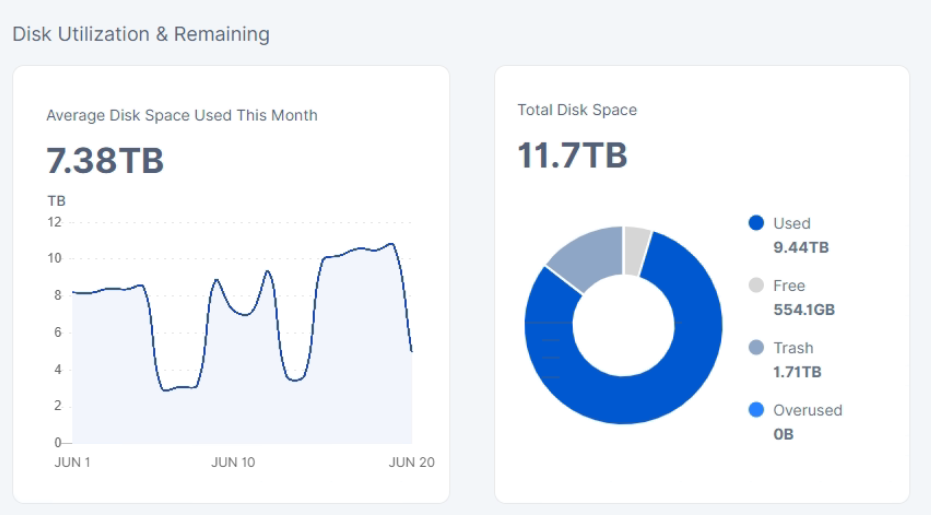
in the config the size is set at 11.7TB
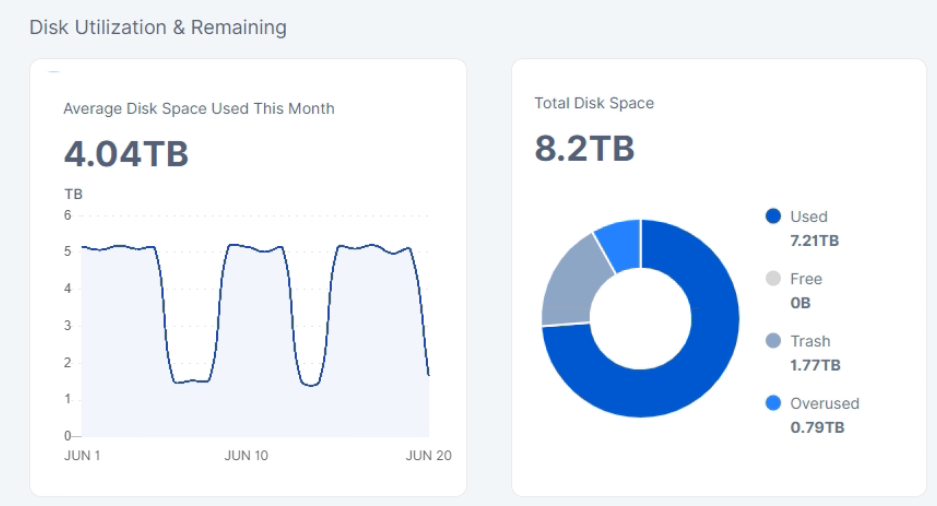
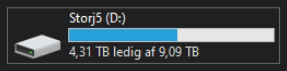
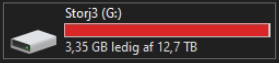
but on this one windows is having a hard time saying the drive is full:
image

it seems all my disk have some sort of weird discrepancy that i cant figure out.
they have done file walkers - but i will do another right now by restarting nodes.

2 Likes

Thanks - i have been looking at this post - just cant figure out it its all the same issues.

Can you check your logs to see if you have these present:

Just going to create another link for people to check their logs to see if my issue is an isolated case or not:

The difference between OS reporting and the dashboard reporting could be caused by several issues:

  • you use a filesystem with a big cluster size (any bigger than 4kiB). On Windows you can see it in the folder properties - it shows the folder size and the size on the disk;
  • your OS reports used space in binary measure units (MiB, GiB, TiB, i.e. base 2), but the dashboard uses SI measure units (base 10);
  • you have issues with databases (you have errors related to the database in your logs or with checking script from the https://support.storj.io/hc/en-us/articles/360029309111-How-to-fix-a-database-disk-image-is-malformed);
  • you have issues with a used-space-filewalker (you have errors related to a filewalker in your logs) or it’s disabled on start (it’s enabled by default).

Yes, it’s finished for all trusted satellites. If you do not have errors related to databases in your logs, then your dashboard should show correct numbers.

Hey @Alexey I tried looking through logs the only error related to a database I see is:

ERROR	piecestore	upload failed	{"Process": "storagenode", "Piece ID": "M6TQFX7HYVYNY6RGJJY65CMWOOT7KAIWQZMQQBDJA6XMKKEZM6VA", "Satellite ID": "1wFTAgs9DP5RSnCqKV1eLf6N9wtk4EAtmN5DpSxcs8EjT69tGE", "Action": "PUT", "Remote Address": "79.127.205.235:56222", "Size": 249856, "error": "pieceexpirationdb: database is locked", "errorVerbose": "pieceexpirationdb: database is locked\n\tstorj.io/storj/storagenode/storagenodedb.(*pieceExpirationDB).SetExpiration:111\n\tstorj.io/storj/storagenode/pieces.(*Store).SetExpiration:584\n\tstorj.io/storj/storagenode/piecestore.(*Endpoint).Upload.func6:486\n\tstorj.io/storj/storagenode/piecestore.(*Endpoint).Upload:544\n\tstorj.io/common/pb.DRPCPiecestoreDescription.Method.func1:294\n\tstorj.io/drpc/drpcmux.(*Mux).HandleRPC:33\n\tstorj.io/common/rpc/rpctracing.(*Handler).HandleRPC:61\n\tstorj.io/common/experiment.(*Handler).HandleRPC:42\n\tstorj.io/drpc/drpcserver.(*Server).handleRPC:167\n\tstorj.io/drpc/drpcserver.(*Server).ServeOne:109\n\tstorj.io/drpc/drpcserver.(*Server).Serve.func2:157\n\tstorj.io/drpc/drpcctx.(*Tracker).track:35"}

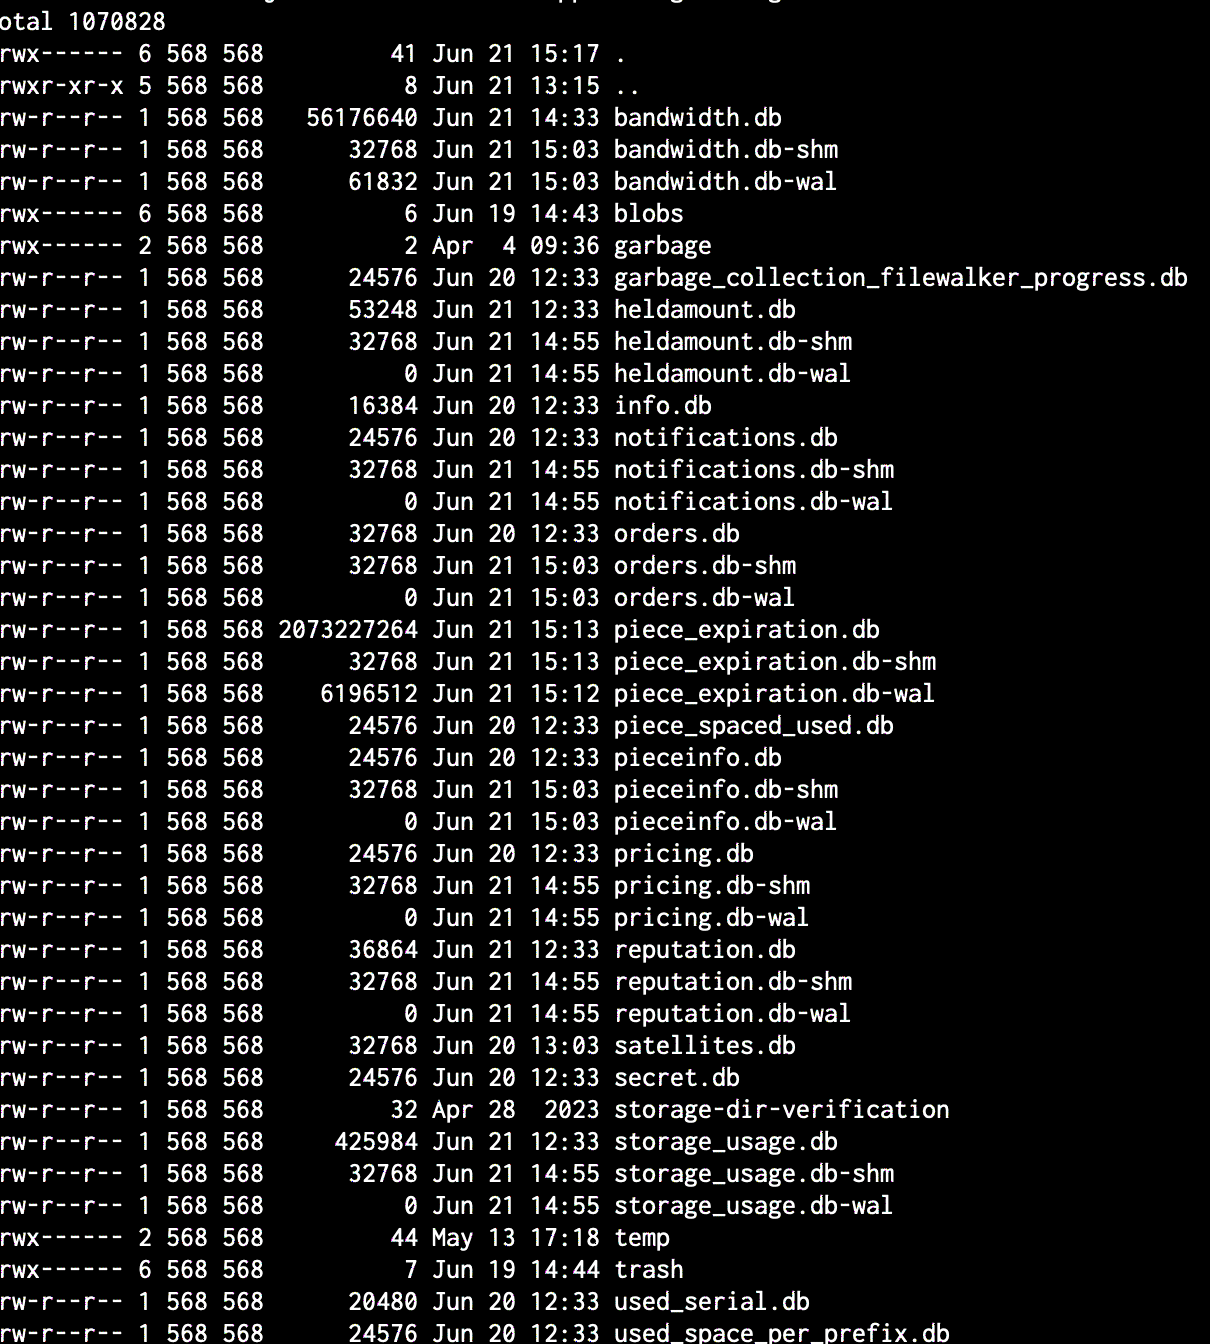
Which I’m not sure how to fix through TrueNAS Scale. As of now Storj has used 100% of the allocated data but does not recognize over 2/3 of it. I found this folder with a bunch of databases in it

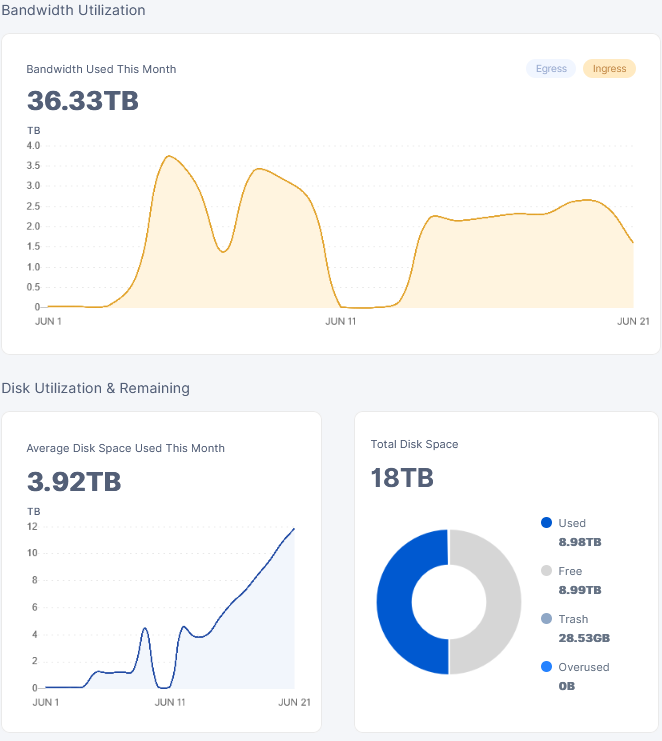
So… I recently added another hard drive to both my nodes that increased them to 18TB (which filled completely yesterday) I restarted my nodes and the dashboard now says there is half the amount of stored data. When I check the drives, its reading full… Nodes were originally 9TB and I increased them to 18TB once it filled up. Maybe I partitioned them incorrectly? Any help would be greatly appreciated!

Filesystem      Size  Used Avail Use% Mounted on
tmpfs           1.6G  1.5M  1.6G   1% /run
/dev/sda2       196G   64G  123G  35% /
tmpfs           7.9G     0  7.9G   0% /dev/shm
tmpfs           5.0M     0  5.0M   0% /run/lock
/dev/sda4       4.9G  136K  4.6G   1% /home
/dev/sda3       2.0G  182M  1.7G  10% /boot
**/dev/sda5        20T   18T  1.1T  95% /mnt/storjdata**
tmpfs           1.6G   12K  1.6G   1% /run/user/1000

I had the same problem.
You are probably pushing the HDD too hard and it’s not writing to the databases properly.

Can you check your logs for “database locked” errors?

I’m not even able to run the command, its almost like it times out…

$ sudo docker logs storagenode |& grep "database locked"

:frowning: so instead, I tried to edit the config.yaml and set the path to the log file and upon restarting the docker container the node never fully restarted. For now I’ve reverted the config.yaml file back. Then I checked the last 20 lines of the log once restarted and its just showing upload data…

2024-06-21T23:32:33Z  INFO piecestore uploaded {
"Process": "storagenode", 
"Piece ID": "CQPZGDOWAULM5IZYYAU5VWWCMTPHAS7P2M7YTRU53MAMDEEK3SSA", 
"Satellite ID": "12L9ZFwhzVpuEKMUNUqkaTLGzwY9G24tbiigLiXpmZWKwmcNDDs", 
"Action": "PUT", 
"Remote Address": "79.127.226.98:41310",
 "Size": 181504}

After reading a few posts in the forum, sounds like its an issue with the firewalker process? With this influx of test data, my node filled up within a matter of days and upon reboot that process had to start again is my guess? I’ll leave the node on for a few more days and see what happens…

The same way - you need to move databases to a less used dataset or to the SSD if you have it. Some uses even USB sticks, if they don’t mind to lose the stat with that stick…
The best would be to add an SSD as a special device as many suggested, since the TrueNAS Scale uses ZFS.

Because it should be

sudo docker logs storagenode 2>&1 | grep "database is locked"

You likely tried to specify the host path, right? It should be a path inside the container, the easiest one is to specify it like

log.output: /app/config/node.log

then the log node.log will be there:

/mnt/storjdata/node.log

It could be, but since you have a little different issue:

which suggests that your node has issues with the databases, either with their locks or corruption or both. The failed filewalker is another set of the problems, but first you need to solve an issue with the databases.

Seriously??? That is the best answer? I thought Storj was to be ran on “spare hardware”? For a system that hasn’t even paid out $100 in a year you guys sure have some flawed hardware demands.

2 Likes

It’s on spare hardware. However, if the spare hardware cannot keep up there are workarounds.
One of them - move databases to a less used disk. Unfortunately I do not have any other suggestion right now.
My DBs are on HDD too, and one of the node has had issues with a “database is locked” errors, which I never saw for the last several years.
I know, that’s mostly related to the high throughput from SLC and that we found this issue with a databases become happen much more often only recently.
As a result - not updated databases and wrong stat on a piechart on the dashboard.
However, no better solution so far.

Yes, that is the answer.
“Spare hardware” doesn’t mean “spare crap hardware”, it’s just we’ve been getting away with that for a long time.

Look, I understand your frustration. The network is being pushed very hard right now so naturally hardware demands also went up. It appears the best thing about stress testing Storj like this was that they discovered choke points and possibly some bugs in the current software design. They won’t be fixed overnight.
In the mean time, a possible solution for your problem (call it a “work around”, if you will) has been suggested by Alex.
It is not a very difficult to implement (in many, but certainly not all circumstances) and not too expensive either (you can get a 64 GB SSD for fairly cheap these days).

If it’s any consolation, you’re not the only one who’s had issues (I currently have a pieces.scan running on a node that’s been going on for 5 days and counting!). This is not a daytime job for anyone (not even @Th3Van!), it’s a good opportunity to learn to tweak and fiddle, make preemptive adjustments to other nodes you may be running or thinking of running and if it all gets too much for you and you decide to quit or the node dies…. well, it’s not the end of the world :slightly_smiling_face:

2 Likes