I migrated a node from Windows to Linux and now the docker container eats up the RAM (16gb) in about an hour. In reading other posts it appears I have a DB file that’s probably been corrupted. The last time I tried fixing a DB file I failed miserably and lost the node. Any suggestions before I attempt this again?
In most cases this is indication of problems with disk subsystem, if it cannot keep up - the process will use more RAM to handle the load.
The broken DB will not lead to disqualification, you just lose a stat, nothing more.
Hi Alexey, thanks for your continuing support! I did copy all the data from the Windows machine across the network to my ubuntu box with the hardware R10 subsystem ext4 filesystem. After the original problem, I’m thinking that maybe there was some funny stuff being sorted out because now, all is working fine. If I restart the container, available ram will be eaten up to 12gb and then after the node runs for a while it goes back down to about 3gb. The node size is a little over 6tb.
R10 seems is RAID10. It could explain the slow disk operations. The node run a filewalker process to calculate a usage and fill up databases, if they were empty or inconsistent. So, seems during this period you seen a high RAM usage. But 3GB of usage during normal processing doesn’t looks right.
The normal usage without problems with disks subsystem usually not more than 300MB, in a very active period it could eat more, but not 3GB and even 12GB.
Please check the usage with docker stats.
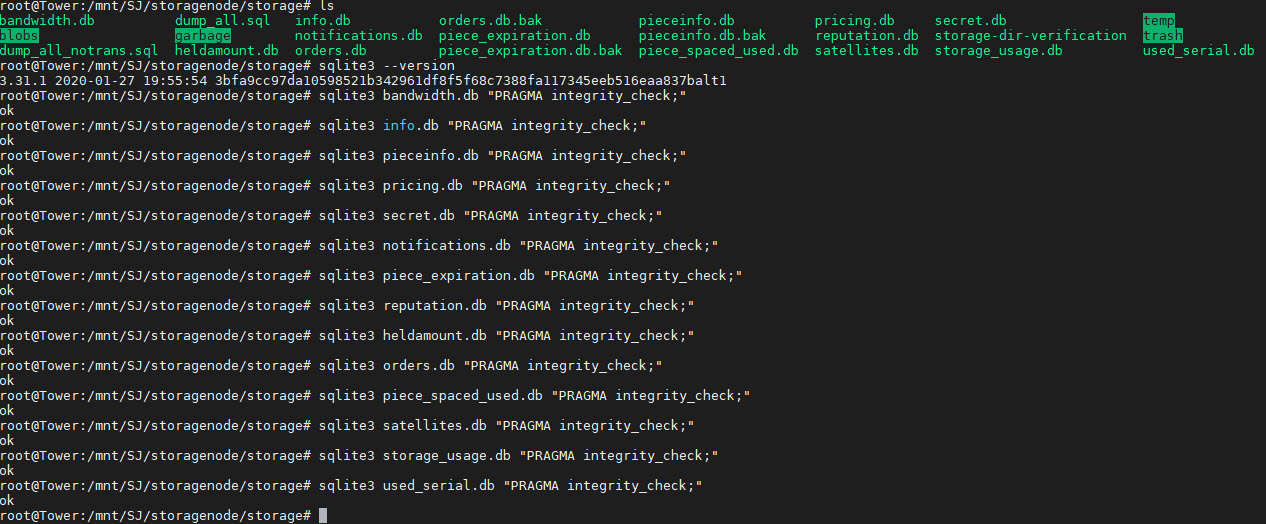
And worth to check databases as well: https://support.storj.io/hc/en-us/articles/360029309111-How-to-fix-a-database-disk-image-is-malformed-
What tool are you using to monitor memory usage?
I ask because it sounds like maybe you are confusing memory buffers/cache with memory usage?
You could post the output of the command
root@raspberrypi1:~# top

top - 08:10:28 up 31 days,  4:31,  2 users,  load average: 0.92, 1.04, 1.17
Tasks: 212 total,   1 running, 211 sleeping,   0 stopped,   0 zombie
%Cpu(s):  4.8 us,  4.7 sy,  0.0 ni, 82.1 id,  5.0 wa,  0.0 hi,  3.4 si,  0.0 st
MiB Mem :   3837.7 total,   1594.7 free,    511.8 used,   1731.3 buff/cache
MiB Swap:      0.0 total,      0.0 free,      0.0 used.   3124.3 avail Mem

  PID USER      PR  NI    VIRT    RES    SHR S  %CPU  %MEM     TIME+ COMMAND
16810 root      20   0  826872  68452  12988 S   5.9   1.7   3824:04 storagenode
16665 root      20   0  828228  58224  12876 S   2.0   1.5   1488:33 storagenode
24508 root      20   0  886652  51288  18528 S   6.6   1.3   2949:40 storagenode
  829 root      20   0 1048448  42832  19960 S   0.0   1.1  26:33.94 dockerd
16390 root      20   0  823196  38116  13020 S   0.3   1.0   1162:31 storagenode
17081 root      20   0  827000  31480  12644 S   9.2   0.8   1631:24 storagenode
storagenode uses virtually nothing, “3124 avail mem” is the important part
CONTAINER ID   NAME           CPU %     MEM USAGE / LIMIT     MEM %     NET I/O           BLOCK I/O   PIDS
7cbadcd58343   storagenode2   3.42%     172.1MiB / 24.81GiB   0.68%     61.8GB / 34.5GB   0B / 0B     40
cf135a75547e   storagenode5   0.02%     99.73MiB / 24.81GiB   0.39%     793MB / 10.2GB    0B / 0B     34
de6dbb76212e   watchtower     0.00%     13.35MiB / 24.81GiB   0.05%     1.65kB / 0B       0B / 0B     15
storagenode5 is full, but storagenode2 is not (and has 3.5TB free).
If databases are ok and you use a local attached storage, then only storage itself could be a reason.
The RAID10 should work faster than RAID5, but could work slower than one HDD if some disks are slow. What types of disks did you use? Are they SMR?
I’m using 8TB SAS Enterprise drives with a 12gb interface on a Avago 9361 controller so performance shouldn’t be an issue. I dunno, since the system releases most of the ram after it’s on for a while I’m OK with the unexplained issue. If you can think of anything else I should try let me know.
The only known reason for high memory usage - when the disk writes are very slow (have a high latency), like using SMB/NFS or SMR disks or BTRFS filesystem (except Synology - they customized BTRFS and it works normally).