Dropping online status

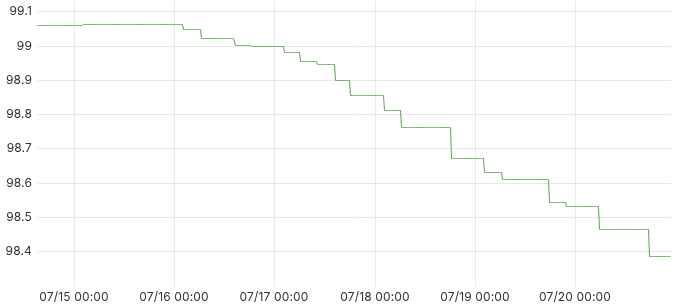
I’m having a problem with my online status. As far as I can tell, the satellites haven’t been able to ping me since July 15. I’m getting these messages in the logs:

2026-07-15T21:08:56+02:00       ERROR   contact:service ping satellite failed   {"process": "storagenode", "satellite_id": "1wFTAgs9DP5RSnCqKV1eLf6N9wtk4EAtmN5DpSxcs8EjT69tGE", "attempts": 1, "error": "ping satellite: failed to ping storage node, your node indicated error code: 0, rpc: tcp connector failed: rpc: dial tcp 87.106.224.175:28967: connect: connection timed out", "errorVerbose": "ping satellite: failed to ping storage node, your node indicated error code: 0, rpc: tcp connector failed: rpc: dial tcp 87.106.224.175:28967: connect: connection timed out\n\tstorj.io/storj/storagenode/contact.(*Service).pingSatelliteOnce:232\n\tstorj.io/storj/storagenode/contact.(*Service).pingSatellite:169\n\tstorj.io/storj/storagenode/contact.(*Chore).updateCycles.func1:89\n\tstorj.io/common/sync2.(*Cycle).Run:163\n\tstorj.io/common/sync2.(*Cycle).Start.func1:77\n\tgolang.org/x/sync/errgroup.(*Group).Go.func1:93"}

I deliberately didn’t change anything in my settings. Does anyone have any idea what might be causing this?
Since I unfortunately have a CGNAT, the node runs through a VPN.
Data is coming through, and the port is open, but a real ping times out. But as far as I know, it’s always been like that.


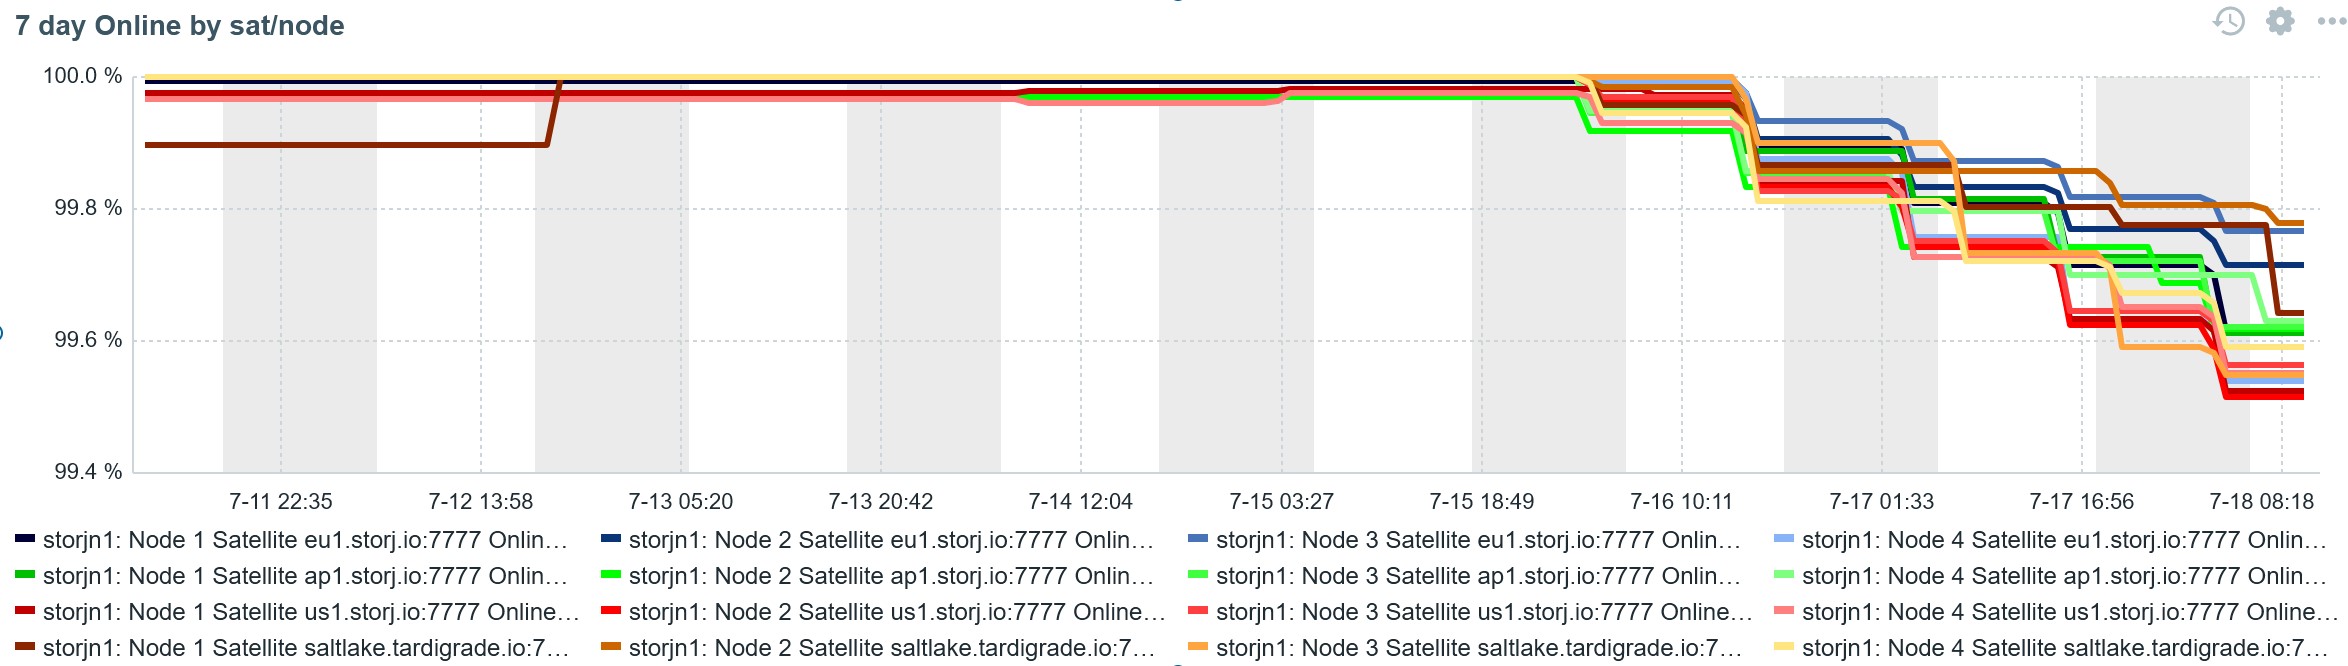
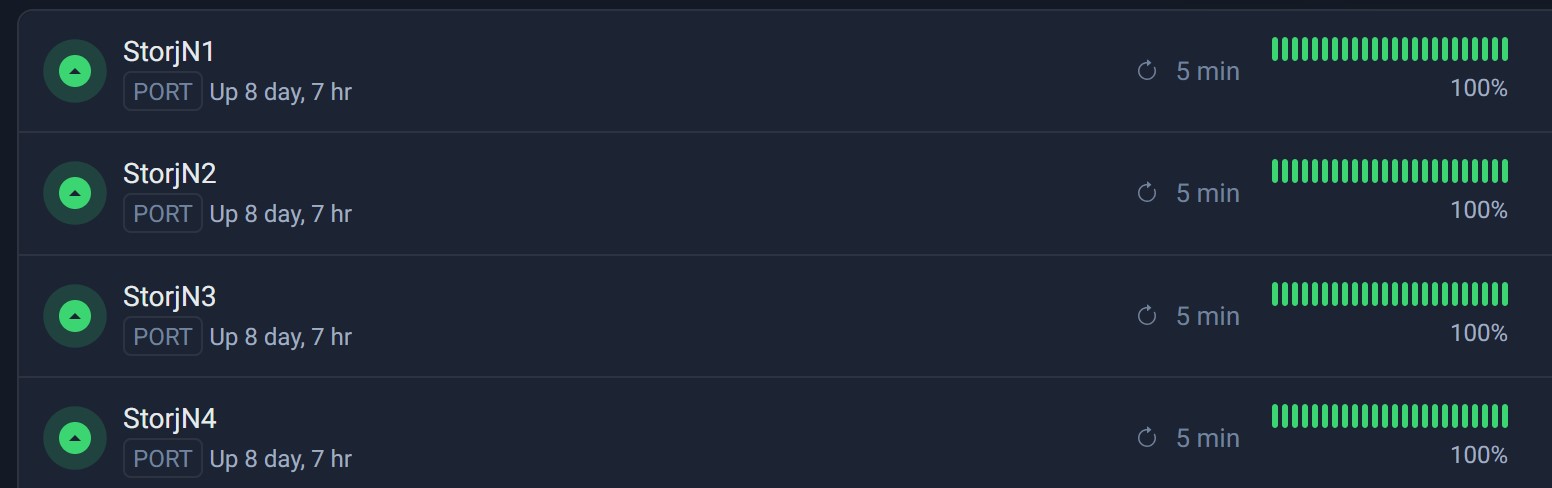
I’m also seeing something similar - all my 4 nodes have had a steadily decreasing online score for about two days now, yet Uptimerobot records no outage, GRC shields up show the ports as open, and piece up/downloads are happening at a normal rate with normal (for me) success rates

No CGNAT, no VPN, just bog-stock IPv4 with the same DHCP address for 2+ years

+1

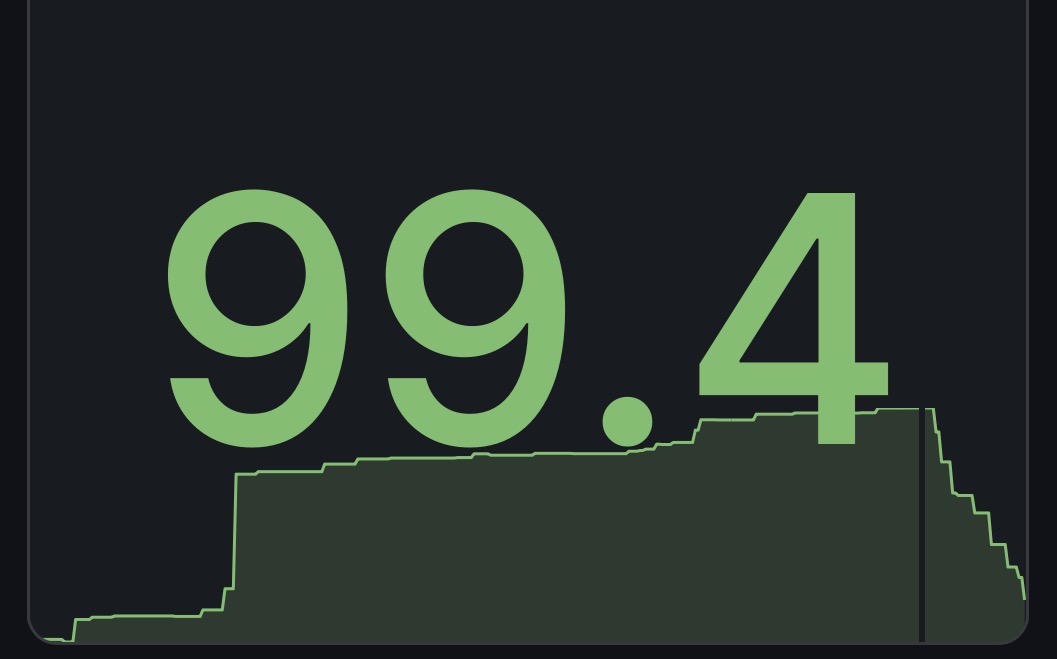
I am seeing my online status drop very slowly (0.1% a day) since a few days. Got a satellite ping error the other day.

I’m seeing exactly the same behavior.

I have tested across three different machines in independent environments, and all of them show the same result.

  • Online status is dropping.
  • Nodes are online and continue transferring data normally.
  • DNS resolution is correct.
  • TCP connectivity to the advertised ports works.
  • QUIC is now reported as Misconfigured.

Since this is happening across independent environments, it doesn’t look like a local configuration issue.

Is anyone else seeing the same behavior?

I have the same problem for the last few days. From all satellites.

Jul 18 10:42:01 storj storagenode[362112]: 2026-07-18T10:42:01Z        ERROR        contact:service        ping satellite failed         {"process": "storagenode", "satellite_id": "1wFTAgs9DP5RSnCqKV1eLf6N9wtk4EAtmN5DpSxcs8EjT69tGE", "attempts": 1, "error": "ping satellite: failed to ping storage node, your node indicated error code: 0, rpc: tcp connector failed: rpc: dial tcp MY_IP:28967: connect: connection timed out", "errorVerbose": "ping satellite: failed to ping storage node, your node indicated error code: 0, rpc: tcp connector failed: rpc: dial tcp MY_IP:28967: connect: connection timed out\n\tstorj.io/storj/storagenode/contact.(*Service).pingSatelliteOnce:232\n\tstorj.io/storj/storagenode/contact.(*Service).pingSatellite:169\n\tstorj.io/storj/storagenode/contact.(*Chore).updateCycles.func1:89\n\tstorj.io/common/sync2.(*Cycle).Run:163\n\tstorj.io/common/sync2.(*Cycle).Start.func1:77\n\tgolang.org/x/sync/errgroup.(*Group).Go.func1:93"}

Similarly:

2026-07-18T11:51:36Z ERROR contact:service ping satellite failed {“process”: “storagenode”, “satellite_id”: “12L9ZFwhzVpuEKMUNUqkaTLGzwY9G24tbiigLiXpmZWKwmcNDDs”, “attempts”: 1, “error”: “ping satellite: failed to ping storage node, your node indicated error code: 0, rpc: tcp connector failed: rpc: dial tcp myIP:28967: connect: connection timed out”, “errorVerbose”: “ping satellite: failed to ping storage node, your node indicated error code: 0, rpc: tcp connector failed: rpc: dial tcp myIP:28967: connect: connection timed out\n\``tstorj.io/storj/storagenode/contact.(*Service).pingSatelliteOnce:232\n\tstorj.io/storj/storagenode/contact.(*Service).pingSatellite:169\n\tstorj.io/storj/storagenode/contact.(*Chore).updateCycles.func1:89\n\tstorj.io/common/sync2.(*Cycle).Run:163\n\tstorj.io/common/sync2.(*Cycle).Start.func1:77\n\tgolang.org/x/sync/errgroup.(*Group).Go.func1:93”``}

Yet just the single occurrence of that message since UTC midnight, but the standard offline query checker gives for the covering time period:

“id”: “12L9ZFwhzVpuEKMUNUqkaTLGzwY9G24tbiigLiXpmZWKwmcNDDs”,
“auditHistory”: [

{
“windowStart”: “2026-07-18T00:00:00Z”,
“totalCount”: 589,
“onlineCount”: 564
},

In my case though, QUIC is not reporting an error

Actually the status is declining more than 0.1% a day on all sats. Uptime monitors are not showing any downtime.

I’m noticing the same problem too.

Hi, I have 14 nodes, I’m having the same problem for a 3-4 days now. Not vetted 2-3 very young nodes does not have this problem. What’s going on?

On my nodes, all four satellites consistently mark about 5% of audits offline, while the logs show satellite callback TCP timeouts. This is a satellite-side issue.

The gradual satellite-modular rollout is an obvious suspect: the modular satellite sends every outbound service through one shared connection pool; the old one used unpolled dialers.

That pool is keyed by node ID, not TCP vs. QUIC or even the requested address. So a QUIC request can get a cached TCP connection, and a request to a new endpoint can get a connection to the old one.

That’s broken, and it’s where I’d look first if it was my job.

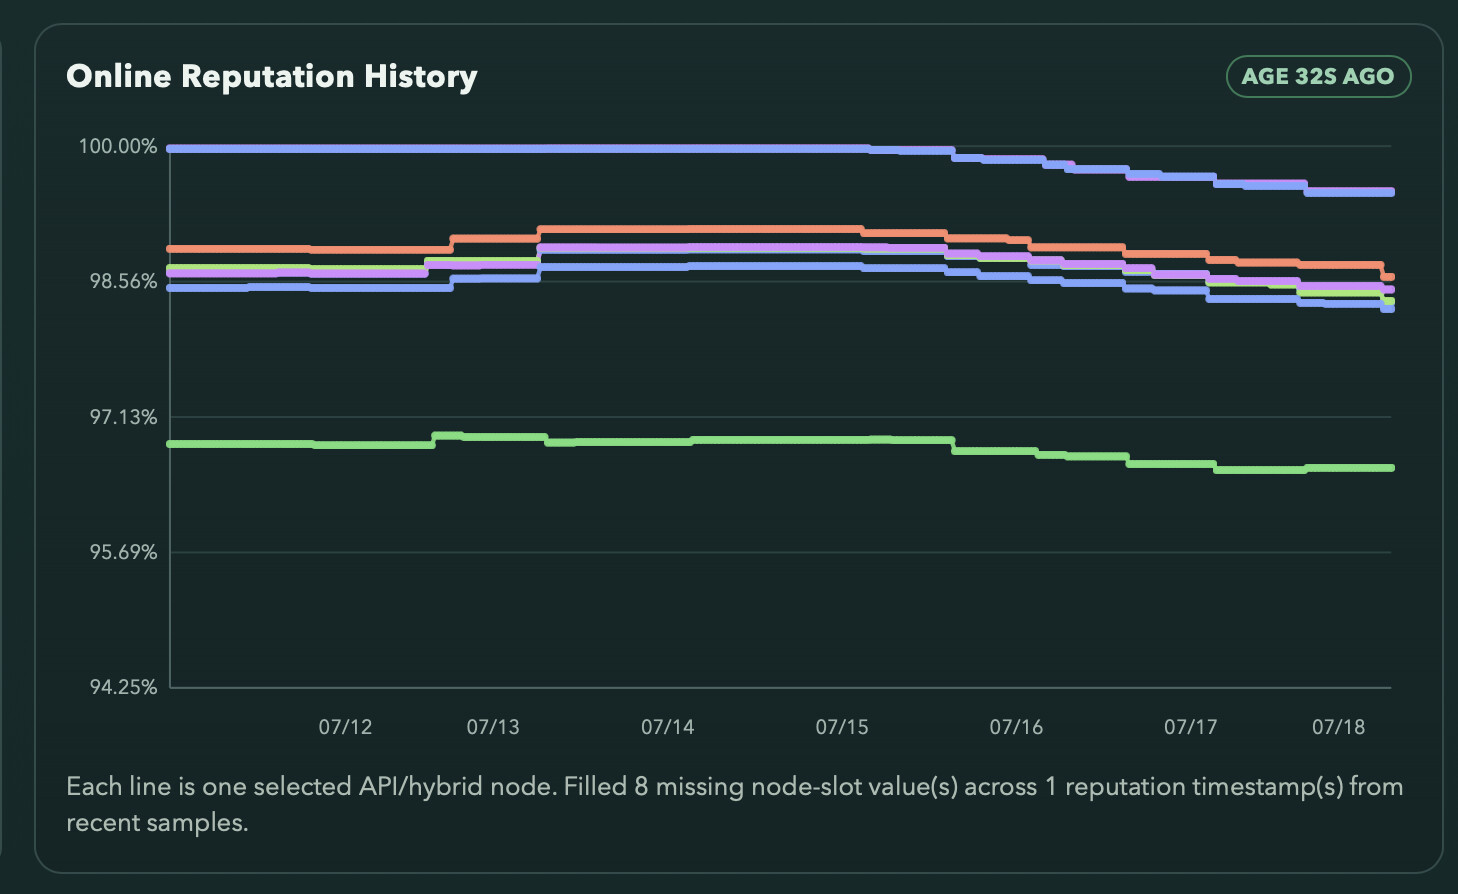
my nodes reputation

Pinged the team to check what’s going on.

This started with the AWS routing outage last week, routing has been crazy since. They say it is fixed but its’s not.

“Last week (July 16, 2026), AWS suffered a 3.5-hour global CloudFront outage. The glitch caused widespread 5xx errors for CloudFront customers using VPC Origins, taking down websites like Hugging Face and the UK National Lottery. The issue was traced to a configuration routing failure and fully resolved by 4:18 AM PDT.”
It was worse than this note says, as many major government, bank and other businesses websites went down for many hours. This is in Europe I don’t know about other parts of the world.

The routing is still partly broken, for me in Sweden the online percentage for all my nodes has been slowly dropping since the outage, the same for the two nodes I have in Thailand.

It is nothing I can do more than watching the Online percentage slowly counting down on all nodes.

Are whole nodes affacted with the problem, or just some percentage of the nodes? Any idea? and does changing the ip address or reestablishing a connection with satellites somehow, may fix the problem? Anything we can do?


Hi,

I’m experiencing the same issue.

Since around the routing problems last week, all of my Storj nodes have been gradually losing Online Score on every satellite.

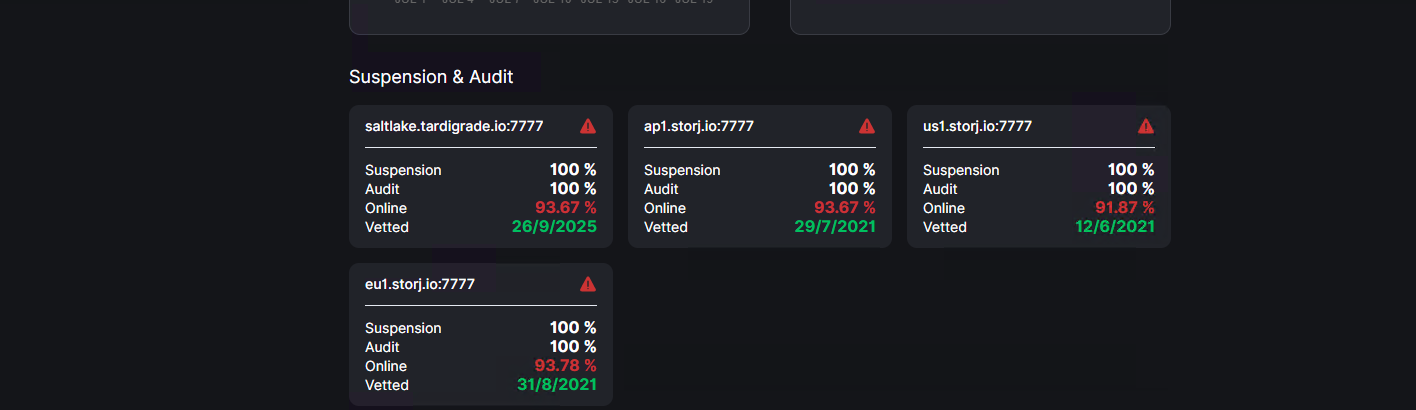
Current status:

  • Suspension: 100%
  • Audit: 100%
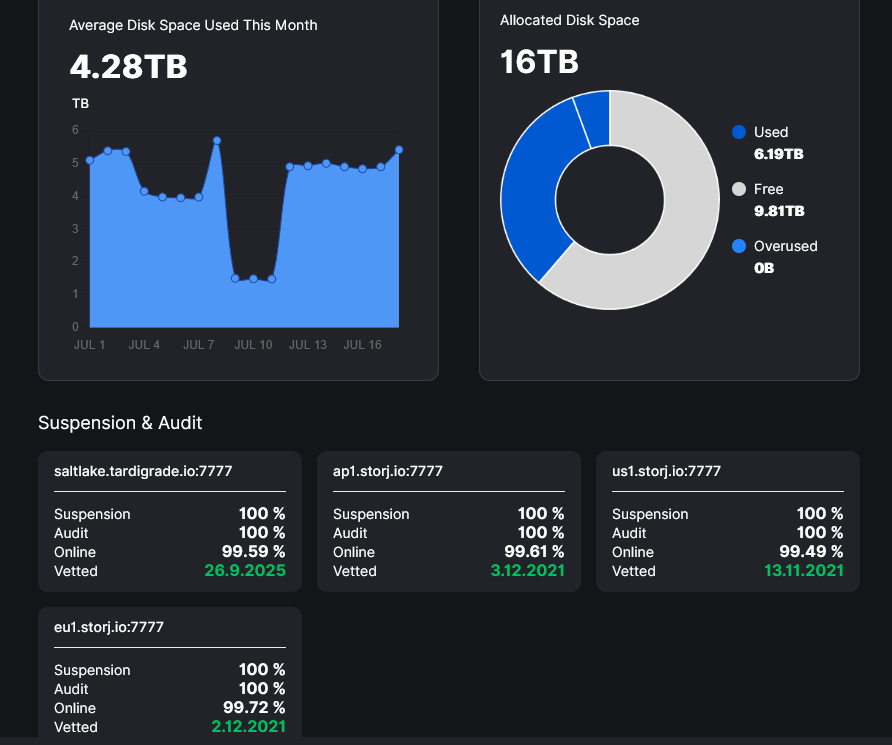
  • Online: between 91% and 94%, depending on the satellite.

In addition, my nodes have had virtually no uploads or downloads for several days. They appear to be reachable:

  • All required ports are open and reachable from the Internet.
  • I have verified external connectivity from multiple locations.
  • The nodes are running and responding.

However, the dashboard reports Offline and QUIC Misconfigured, and traffic has almost completely stopped.

I’m also seeing monitoring issues such as HTTP 500/502 errors from services like SiaScan, so I’m wondering if there is a broader networking or routing problem affecting connectivity between satellites and storage nodes.

Is anyone else seeing the same combination of:

  • decreasing Online Score,
  • almost no ingress/egress,
  • Offline / QUIC Misconfigured status,
  • while the nodes remain externally reachable?

I noticed declining online scores but no ingress/egress decline or quic errors. In fact I see highest ingress ever. I guess this is because many fast nodes are full now because of no bloom filters.

I’ll share some additional information in case it helps. My storage node is located in AS16276. Satus: Online, QUIC: OK. I reduced the storage size a few months ago, so “ingress” is 0, “egress” is within the normal state for my node.

Same issue here in DK. Multiple locations/hardware/ISPs - all drops similar.

Example:

I’ll chime in, with one of my nodes even receiving an offline email. Though, all others just seem to have intermittent online check failures only.

This is mean that your node is definitely offline, you need to fix this issue. You may check your address with a port from your mobile phone via the mobile internet, if it doesn’t respond, your node is offline. http://node_external_address:node_port

No word from Storj on this ? Is it an routing issue or is it a storj issue ?

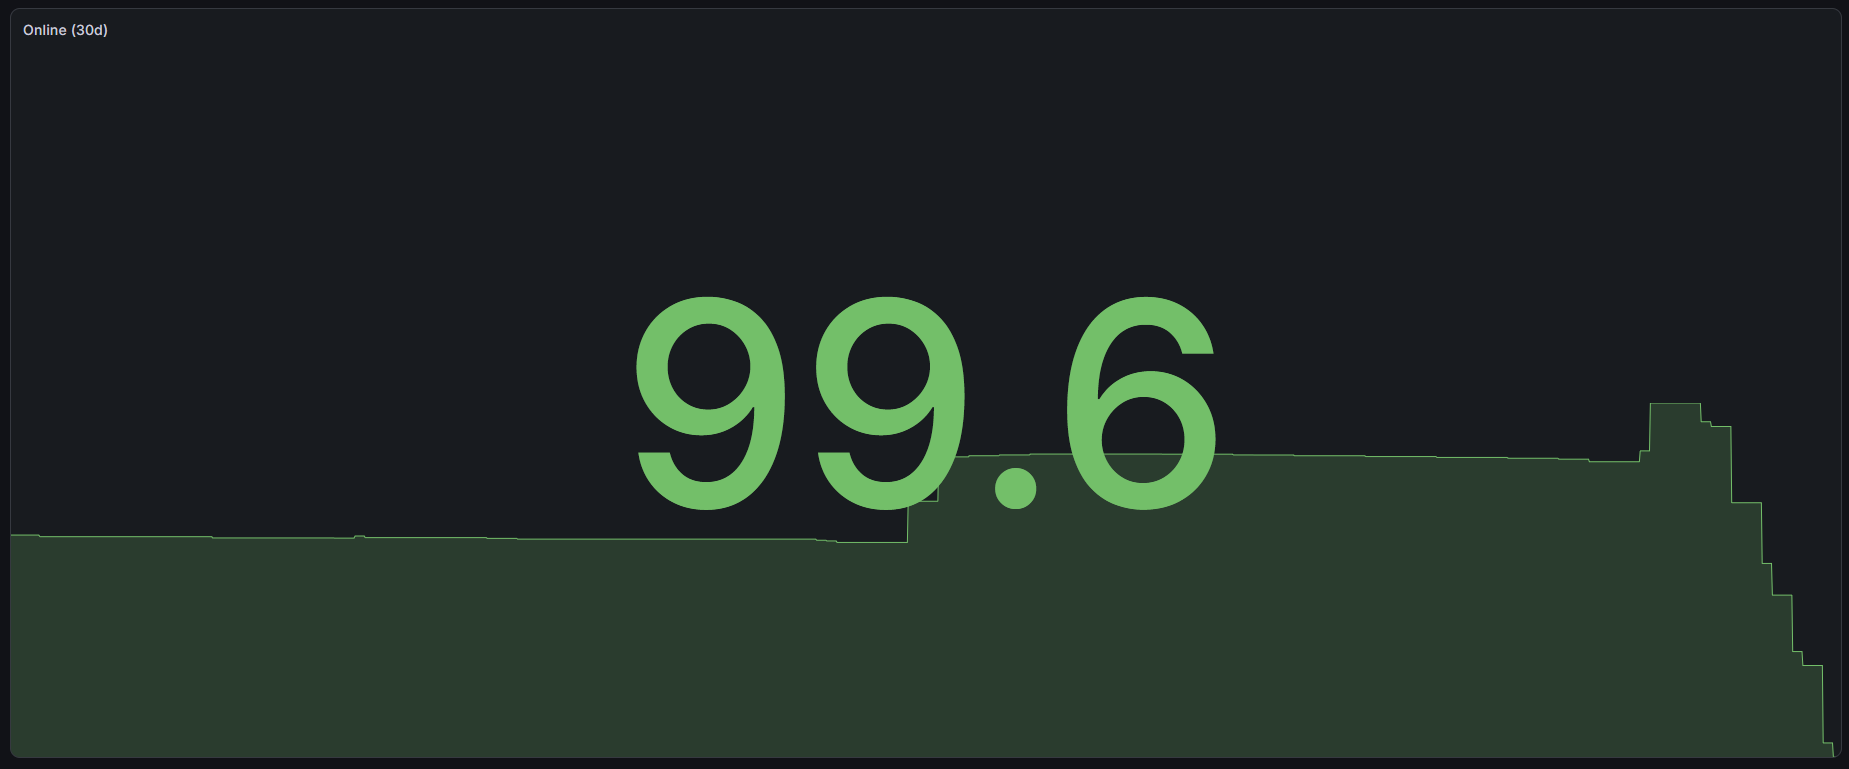
All my nodes in Sweden and my nodes in Thailand has slowly been ticking down from 100% to under 99% today (1% in one day) but no problem yet, it is a long way to 60% which I believe is the minimum and I get kicked out.

if I do a simple mtr but use TCP not icmp to one of the satellites,

root@pm106:~# mtr -T -P 7777 -c 4 -rw  us1.storj.io
Start: 2026-07-21T07:54:23+0200
HOST: pm106                        Loss%   Snt   Last   Avg  Best  Wrst StDev
  1.|-- 212.105.0.26                  0.0%     4    7.2   2.5   0.9   7.2   3.1
  2.|-- ae138-c1-28964.ip.telenor.se  0.0%     4    1.5   1.4   1.3   1.6   0.1
  3.|-- ae0-b1-28966.ip.telenor.se    0.0%     4    1.2   1.4   1.2   1.7   0.2
  4.|-- sto-b2-link.ip.twelve99.net   0.0%     4    2.2   2.1   1.8   2.3   0.2
  5.|-- sto-bb2-link.ip.twelve99.net  0.0%     4  2054. 533.5  26.3 2054. 1014.2
  6.|-- kbn-bb6-link.ip.twelve99.net  0.0%     4   26.4  26.5  26.4  26.7   0.1
  7.|-- ewr-bb2-link.ip.twelve99.net  0.0%     4  2176. 620.5 101.8 2176. 1037.2
  8.|-- ash-bb2-link.ip.twelve99.net  0.0%     4   98.7  98.4  98.2  98.7   0.3
  9.|-- atl-bb2-link.ip.twelve99.net 50.0%     4  155.0 160.3 155.0 165.5   7.4
        ewr-bb2-link.ip.twelve99.net
 10.|-- atl-b24-link.ip.twelve99.net  0.0%     4  1177. 417.2 161.0 1177. 506.7
        chi-bb2-link.ip.twelve99.net
 11.|-- dls-bb1-link.ip.twelve99.net  0.0%     4  155.2 158.4 155.2 162.1   3.6
        kanc-bb2-link.ip.twelve99.net
 12.|-- lax-bb2-link.ip.twelve99.net 50.0%     4  150.4 150.5 150.4 150.7   0.3
 13.|-- lax-b22-link.ip.twelve99.net  0.0%     4  155.8 154.5 150.2 156.1   2.8
        lax-b22-link.ip.twelve99.net
 14.|-- lax-bb2-link.ip.twelve99.net  0.0%     4  166.4 166.2 165.8 166.4   0.3
        datacamp-ic-382478.ip.twelve99-cust.net
 15.|-- lax-b22-link.ip.twelve99.net 25.0%     4  5300. 1870. 150.4 5300. 2970.6
        vl221.lax-drt11-dist-1.cdn77.com
 16.|-- unn-89-187-186-33.cdn77.com   0.0%     4  161.5 165.0 161.1 176.2   7.5
        datacamp-ic-382478.ip.twelve99-cust.net


It finds the way but twelve99.net seems to have issues, packet losses and extreme response times, maybe that causes some ‘node up’ checks to get lost? It can’t be all ‘node up’ checks getting lost because when it would be ticking down much faster and I would receive mail that my node is down.

If I do the same mtr test but to google on port 443 I have 0% loss and response times between 2ms - 4ms

PS: Since the AWS routing crash I noticed that my nodes in Thailand do not go east to connect to the US satellites, they go west with RTT around 330ms !