Is anyone else seeing the % of repair traffic rise over time? Over the last few months for my node, it has been slowly heading to the 50% mark, with yesterday showing a major spike to well over 50%. At the start of the year, repair/audit traffic made up about 10% of my Egress traffic.
Logically more repair traffic means that the network is having to deal with nodes disconnecting for one reason or another, but I do not monitor the state of the network so I do not know exactly what is going on.
One thing that is clear is that while I’m handling an ever-growing amount of traffic the overall amount I am storing is not rising very fast.
From a storage node perspective that is hard to tell. I have created a new node recently and it is starting with a low amount of repair traffic. Why should a file get repaired that was uploaded a few days ago? The older your node is the more files you are holding that need repair at some point.
The issue is more about the number of nodes that are being lost over any time period. If the frequency of node loss is rising then the amount of repair traffic to maintain the network is going to increase.
That is the issue if the network of nodes is stable or new nodes are joining the % of repair traffic should stay low. What I am seeing is the % and total amount of repair traffic rising a lot compaired to the amount my node is growing. Some example figures are below
Jan
39.29GB of Repair & Audit Engress
391.80GB of Download Ergress
3890.00GB of Average Disk Storage
vs
Sept
343.39GB of Repair & Audit Engress
363.22GB of Download Ergress
5700.00GB of Average Disk Storage
So while my storage space has increased by 46% by Repair & Audit Engress has increased by 873%.
Now we are going full cycle. You would expect the repair traffic to rise over time. The real question should be if we can get that data from the satellite. That would contain a good picture over all storage nodes.
But why on a system with a stable set of nodes would you expect repair traffic to rise faster than the data you store?
Repair traffic comes from the need to recreate blocks because nodes have gone off-line without performing the exit process. So to see an 873% increase in repair traffic compared to just 46% in data stored means the way in which the network operates has changed - the only logical answers at the moment are that a lot of nodes are dropping from the network, or the platform originally allowed a lot of the spare blocks to be ‘lost’ from the platform and this has now changed.
It is rather clear that the way that the exit process has been priced has issues - my node has nearly 6TB of data, but there is just $11.86 held back and as I have been around for more that 15 months that figure will not be increased. This does not really justify me running the exit process if I was to take my node offline and it no way covers the resulting payments for the erasure code regeneration of 6TB of data.
Because when data gets older the chances of it hitting the repair threshold go up. Data that was just stored on your node will still have 80 pieces. It takes time to lose around 30 of those and hit the repair limit.
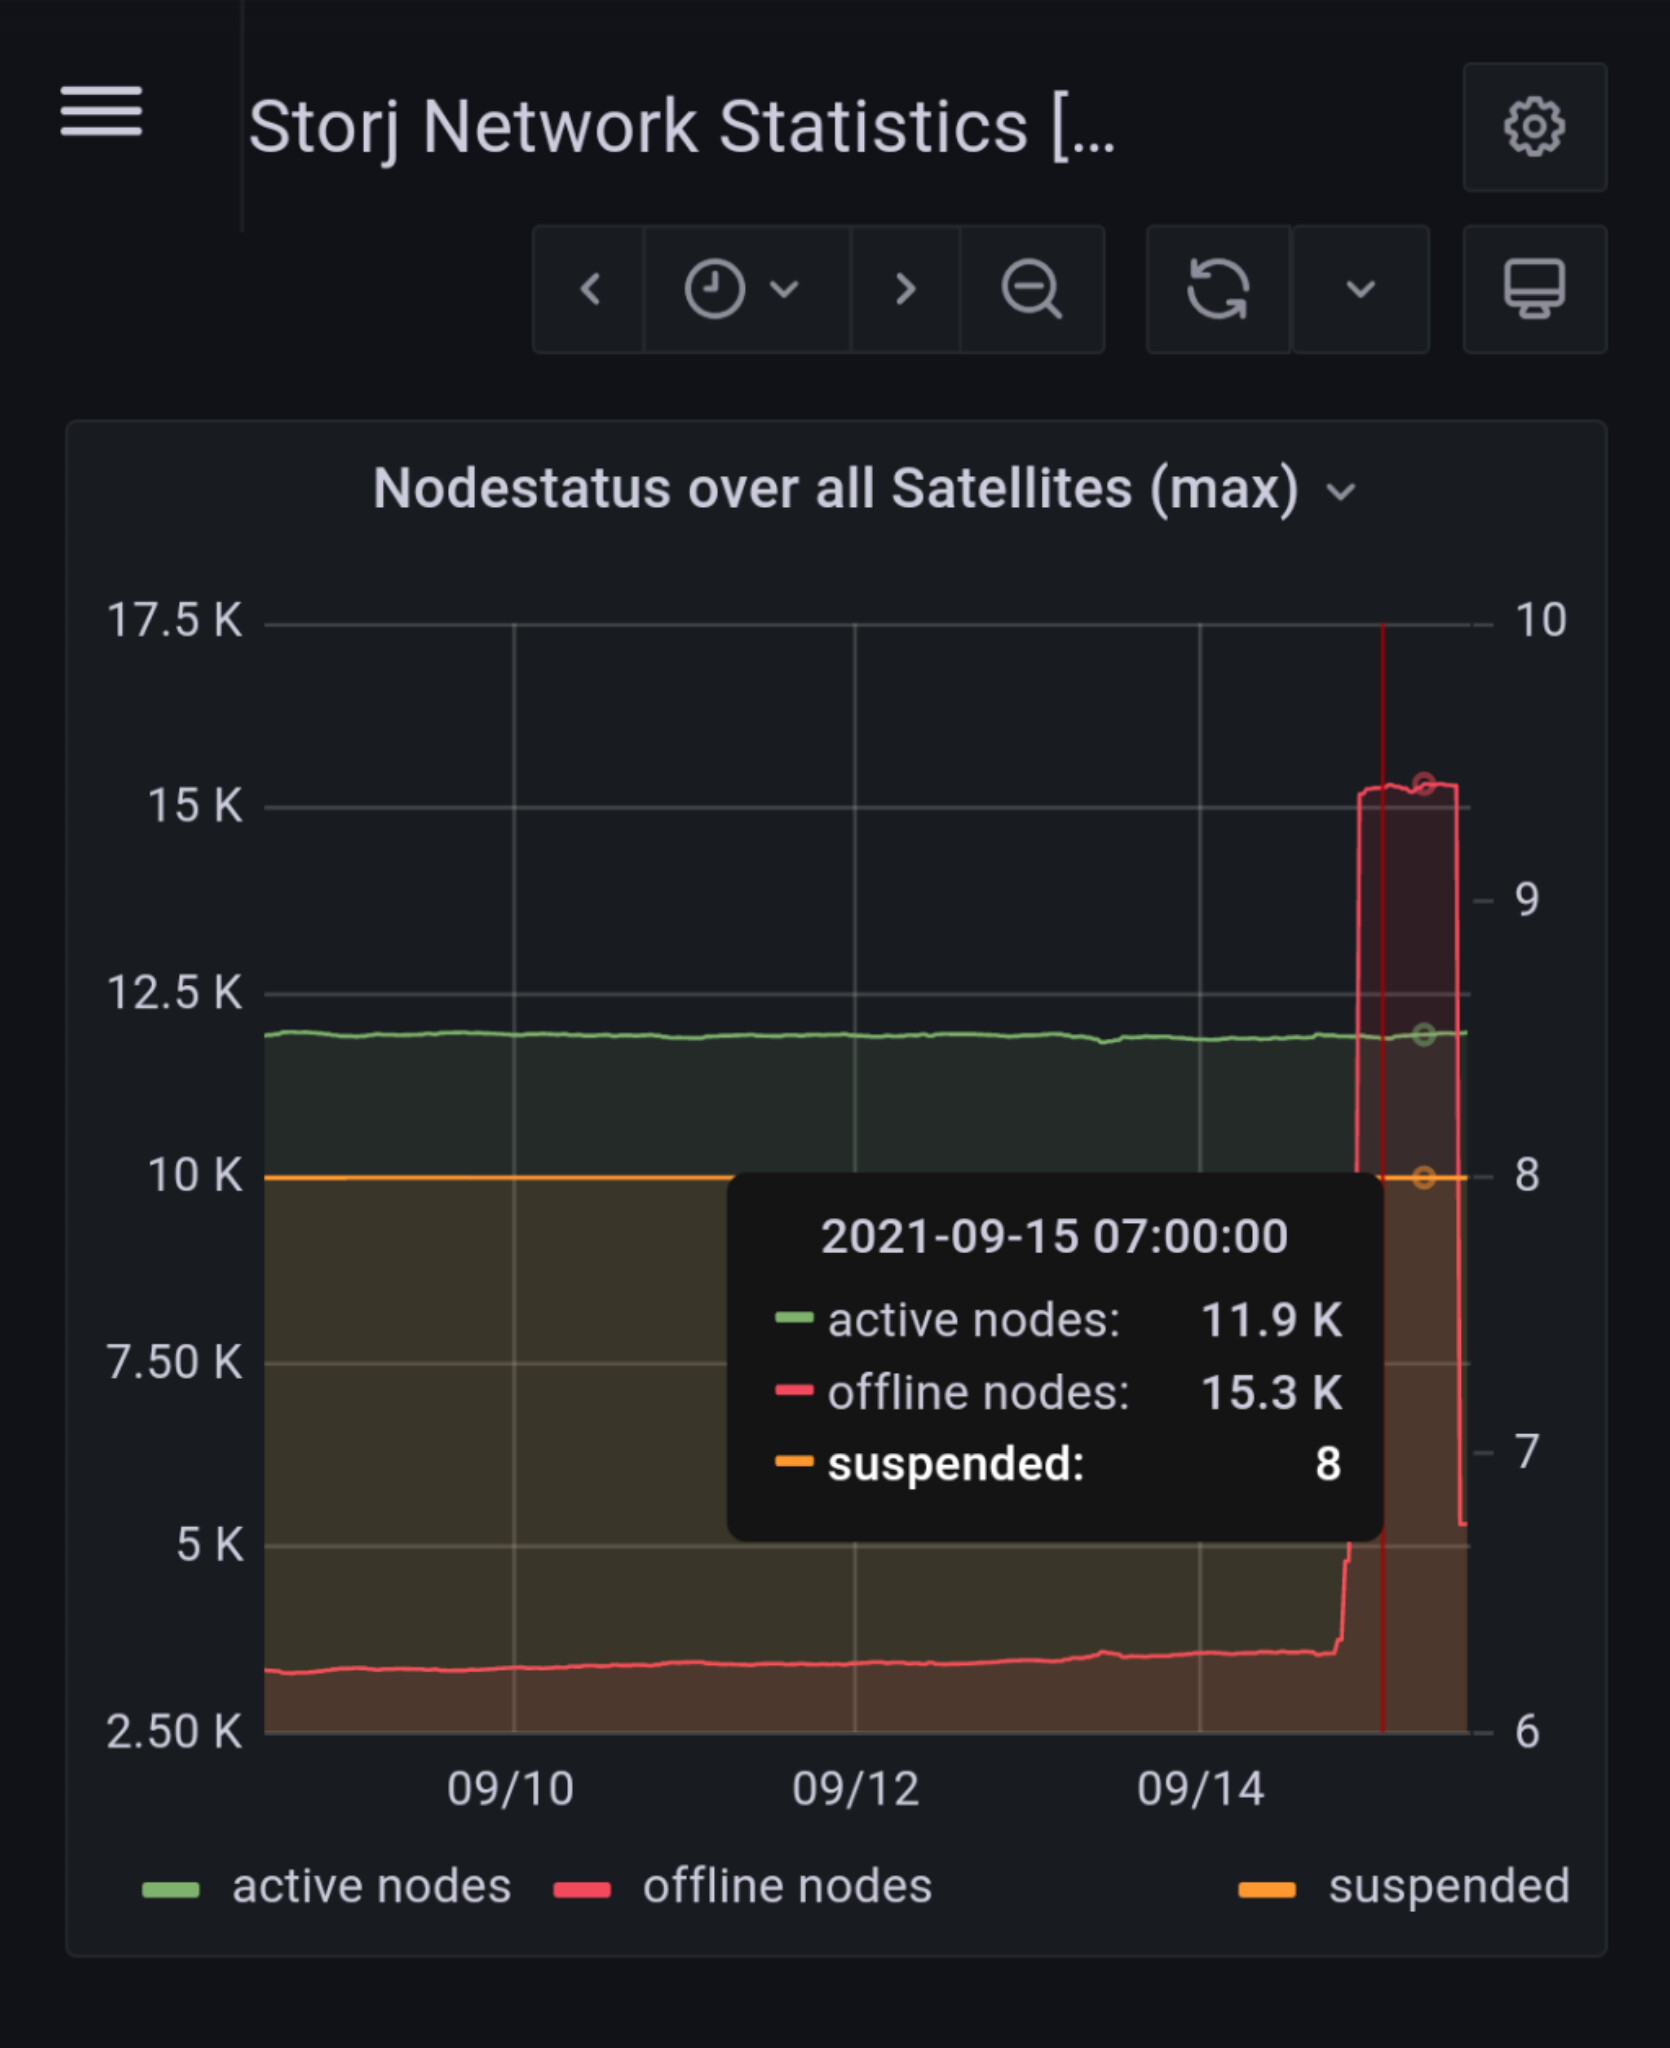
Possibly muddying the water abit, but a poster in another thread linked to a Graphana page that they had made that scrapped the public StorJ stats and it does show a spike on offline nodes for Sept (this could trigger a lot of repair traffic). Link to specific chart: Grafana
yeah, but there is clearly something wrong with that image… Massive increase in offline nodes, but no drop in active nodes? Where did those nodes come from?
The data set that the graphs are trying to use may have changed in some way. You can see the detail of a graph by using the explore option against the item when shown in the dashboard.
For offline nodes this shows an increase from 3568 to 5313 over the last month, if you exclude the rather unlikely jump to over 15,000, which would be all the nodes in the network. The following link should take you to the detail
Yes this is normal and I would expect that it depends on the age of your node. A brand new node will start with almost no repair traffic. The older the node gets the more repair traffic you will see.
Again you can’t estimate the total repair traffic over all satellites just by looking at your node. That doesn’t work. Isn’t the public stats endpoint showing the global repair traffic? That would be a better value to track.