thats a good idea, i will do the same, it rly sounds like that we have the same issue ![]()
I’ll keep you updated on my findings. I have found this topic as well: Fatal Error on my Node - #245 by Alexey
They fixed some errors in the latest release. Now the hardware shuts down, but it looks like this is intended in the fix. Upping the following params in the config.yml might be a fix, but I have not tested this yet: Fatal Error on my Node - #279 by Asura99.
First I will see what error occurs in the log, then I will try this config.yml change. If you want to try this, do not forget to restart the node, else the new config is not loaded.
1 Like
You can just check your logs when the node is stopped:
The last error likely will be the cause.
You may also filter the log for specific text, i.e.
Get-Content "$env:ProgramFiles/Storj/Storage Node/storagenode.log" | sls "fatal" | select -last 10
1 Like
that is my error, this time i didnt even got an email, only the dashboard is down
eRPC:33\n\tstorj.io/common/rpc/rpctracing.(*Handler).HandleRPC:61\n\tstorj.io/common/experiment.(*Handler).HandleRPC:42\n\tstorj.io/drpc/drpcserver.(*Server).handleRPC:124\n\tstorj.io/drpc/drpcserver.(*Server).ServeOne:66\n\tstorj.io/drpc/drpcserver.(*Server).Serve.func2:114\n\tstorj.io/drpc/drpcctx.(*Tracker).track:35", “Size”: 14848, “Remote Address”: “178.234.43.174:59092”}
2023-04-13T06:06:42.029+0200 FATAL Unrecoverable error {“error”: “piecestore monitor: timed out after 1m0s while verifying writability of storage directory”, “errorVerbose”: “piecestore monitor: timed out after 1m0s while verifying writability of storage directory\n\tstorj.io/storj/storagenode/monitor.(*Service).Run.func2.1:150\n\tstorj.io/common/sync2.(*Cycle).Run:160\n\tstorj.io/storj/storagenode/monitor.(*Service).Run.func2:146\n\tgolang.org/x/sync/errgroup.(*Group).Go.func1:75”}
Seems you have a slow disk subsystem, please try to increase a writeability timeout:
If you have databases on Data HDD with this much egress hdd is overloaded, and when you call dashboard it just struggle to answer. Just think Ingress is about 100-140GB a day, + egress + other operations with DB, i had this problem on one node, where i forgot to put DBs to SSD, after mooved, no problem was any more.
0 errors found this way ![]() ( with chkdsk )
( with chkdsk )
So jumping into this thread after finding this same issue on my nodes, but this thread has a LOT of content. Do I have this summary correct?
In 1.75.2 a change was made to report disk timeouts at a period that is either shorter than before or had not been set before at all. In turn it is throwing errors on nodes that previously indicated no problem because they weren’t being “caught” for being slow.
My config is an RPi3 (thus 1GB RAM) with 1 disk per node in docker, the disks are attached in a USB 3.0 dock, are 2TB/2TB/8TB, while the 2TB hosted nodes are full the disks are not, the 8TB node is nowhere near full, and all disks are CMR. It is sounding to me like running multiple nodes on an RPi3 is no longer an option, I guess unless you’re going to do so on SSDs. Is this a fair assessment?
2 Likes
Hi. Forget about it. Seems the v1.75.2 is meant to flush out older/slower nodes. Forget the “don’t buy equipment and use your own resources” policy. Nowadays you can’t just use spare HDD space for Storj…
1 Like
Running 3x nodes via docker on an RPi3 with 3 disks (2G, 2G, 8G) connected via a USB 3.0 dock, have been doing so for a couple years now without issue. Recently I’ve started seeing problems. My node uptimes have been very short (<24h at best), I’ve been seeing suspension values as low as 95%, and it seems (based on disk activity) I’m constantly running the filewalker. The filewalker would make sense if the nodes are restarting. I’ve been digging through the logs and found this for one of my nodes:
2023-04-13T14:30:32.022Z	INFO	piecestore	download started	{"Process": "storagenode", "Piece ID": "NKWJ7JTEDF3FQFTBR2P6RBSXQGZA33ABXPSOM5C4EJ624FDI3GXA", "Satellite ID": "12EayRS2V1kEsWESU9QMRseFhdxYxKicsiFmxrsLZHeLUtdps3S", "Action": "GET", "Offset": 0, "Size": 256, "Remote Address": "38.104.84.242:57590"}
2023-04-13T14:30:32.042Z	ERROR	services	unexpected shutdown of a runner	{"Process": "storagenode", "name": "piecestore:monitor", "error": "piecestore monitor: timed out after 1m0s while verifying readability of storage directory", "errorVerbose": "piecestore monitor: timed out after 1m0s while verifying readability of storage directory\n\tstorj.io/storj/storagenode/monitor.(*Service).Run.func1.1:137\n\tstorj.io/common/sync2.(*Cycle).Run:160\n\tstorj.io/storj/storagenode/monitor.(*Service).Run.func1:133\n\tgolang.org/x/sync/errgroup.(*Group).Go.func1:75"}
2023-04-13T14:30:32.055Z	ERROR	piecestore:cache	error getting current used space: 	{"Process": "storagenode", "error": "context canceled; context canceled; context canceled; context canceled; context canceled", "errorVerbose": "group:\n--- context canceled\n--- context canceled\n--- context canceled\n--- context canceled\n--- context canceled"}
2023-04-13T14:30:32.209Z	ERROR	gracefulexit:chore	error retrieving satellites.	{"Process": "storagenode", "error": "satellitesdb: context canceled", "errorVerbose": "satellitesdb: context canceled\n\tstorj.io/storj/storagenode/storagenodedb.(*satellitesDB).ListGracefulExits.func1:152\n\tstorj.io/storj/storagenode/storagenodedb.(*satellitesDB).ListGracefulExits:164\n\tstorj.io/storj/storagenode/gracefulexit.(*Service).ListPendingExits:59\n\tstorj.io/storj/storagenode/gracefulexit.(*Chore).AddMissing:58\n\tstorj.io/common/sync2.(*Cycle).Run:160\n\tstorj.io/storj/storagenode/gracefulexit.(*Chore).Run:51\n\tstorj.io/storj/private/lifecycle.(*Group).Run.func2.1:87\n\truntime/pprof.Do:40\n\tstorj.io/storj/private/lifecycle.(*Group).Run.func2:86\n\tgolang.org/x/sync/errgroup.(*Group).Go.func1:75"}
2023-04-13T14:30:33.703Z	INFO	piecestore	download canceled	{"Process": "storagenode", "Piece ID": "HZYWWTA3UVLPKCHMWYYPKOXLNDLY6QKSI4TF5ESSZV4N3HOHLDDQ", "Satellite ID": "12EayRS2V1kEsWESU9QMRseFhdxYxKicsiFmxrsLZHeLUtdps3S", "Action": "GET", "Offset": 0, "Size": 0, "Remote Address": "38.104.84.242:32628"}
...
2023-04-13T14:30:36.609Z	INFO	Configuration loaded	{"Process": "storagenode", "Location": "/app/config/config.yaml"}
2023-04-13T14:30:36.630Z	INFO	Anonymized tracing enabled	{"Process": "storagenode"}
2023-04-13T14:30:36.718Z	INFO	Operator email	{"Process": "storagenode", "Address": "user@email.com"}
2023-04-13T14:30:36.719Z	INFO	Operator wallet	{"Process": "storagenode", "Address": "0xFFFFFFFFFFFFFFFFFFFFFFFFFFFFFFFFFFFFFFFF"}
2023-04-13T14:30:37.369Z	INFO	server	kernel support for server-side tcp fast open remains disabled.	{"Process": "storagenode"}
2023-04-13T14:30:37.369Z	INFO	server	enable with: sysctl -w net.ipv4.tcp_fastopen=3	{"Process": "storagenode"}
2023-04-13T14:30:37.792Z	INFO	Telemetry enabled	{"Process": "storagenode", "instance ID": "xxxxxxxxxxxxxxxxxxxxxxxxxxxxxxxxxxxxxxxxxxxxxxxxxxx"}
2023-04-13T14:30:37.792Z	INFO	Event collection enabled	{"Process": "storagenode", "instance ID": "xxxxxxxxxxxxxxxxxxxxxxxxxxxxxxxxxxxxxxxxxxxxxxxxxxx"}
2023-04-13T14:30:38.045Z	INFO	db.migration	Database Version	{"Process": "storagenode", "version": 54}
2023-04-13T14:30:39.793Z	INFO	preflight:localtime	start checking local system clock with trusted satellites' system clock.	{"Process": "storagenode"}
2023-04-13T14:30:40.475Z	INFO	preflight:localtime	local system clock is in sync with trusted satellites' system clock.	{"Process": "storagenode"}
2023-04-13T14:30:40.476Z	INFO	bandwidth	Performing bandwidth usage rollups	{"Process": "storagenode"}
2023-04-13T14:30:40.480Z	INFO	trust	Scheduling next refresh	{"Process": "storagenode", "after": "5h44m25.551225209s"}
2023-04-13T14:30:40.481Z	INFO	pieces:trash	emptying trash started	{"Process": "storagenode", "Satellite ID": "12rfG3sh9NCWiX3ivPjq2HtdLmbqCrvHVEzJubnzFzosMuawymB"}
2023-04-13T14:30:40.482Z	INFO	Node xxxxxxxxxxxxxxxxxxxxxxxxxxxxxxxxxxxxxxxxxxxxxxxxxxx started	{"Process": "storagenode"}
2023-04-13T14:30:40.489Z	INFO	Public server started on [::]:28967	{"Process": "storagenode"}
2023-04-13T14:30:40.489Z	INFO	Private server started on 127.0.0.1:7778	{"Process": "storagenode"}
2023-04-13T14:30:40.490Z	INFO	failed to sufficiently increase receive buffer size (was: 176 kiB, wanted: 2048 kiB, got: 352 kiB). See https://github.com/quic-go/quic-go/wiki/UDP-Receive-Buffer-Size for details.	{"Process": "storagenode"}
2023-04-13T14:30:40.522Z	INFO	piecestore	download started	{"Process": "storagenode", "Piece ID": "UMLDDL4FMWT5FZNVLVAXBS7YPYZV2VYQYFCDKAQQPOHNSRJTDKBA", "Satellite ID": "12EayRS2V1kEsWESU9QMRseFhdxYxKicsiFmxrsLZHeLUtdps3S", "Action": "GET", "Offset": 0, "Size": 1536, "Remote Address": "38.104.84.242:22568"}
Hopefully I trimmed out all the personal info.
Thoughts on what might be going on or what I need to investigate? I was going to be moving logs/DBs to an SSD soon, but if this isn’t an I/O issue I don’t have much other option. I’ve got an RPi4 I could replace this with but it is still only one of the 1GB memory models so no gain there.
There is already a thread that discusses this topic.
"piecestore monitor: timed out after 1m0s while verifying readability of storage directory", "errorVerbose":
See:
1 Like
Thanks, hadn’t seen that thread. I’ll go review.
@Alexey can you either merge or lock this thread I’ve opened since it appears unnecessary?
With all respect but you are simple wrong.
We fixed an old bug, causing a disqualification due to temporary responsiveness of the hardware - the read/write checkers just hangs forever instead crash of the node, because they have not had any timeout and node started to fail audits.
What you need to do is either improve the performance of the disk subsystem (do not use network filesystems, BTRFS, exFAT, NTFS under Linux, try to do not use SMR disks or try to migrate the USB disk to be internal) or increase a timeout.
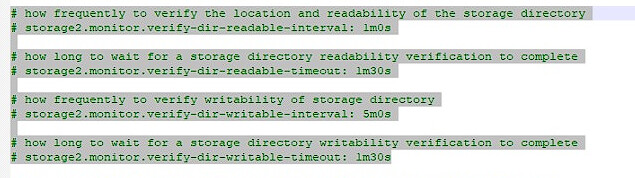
Just note, there are two checkers and related timeouts:
So, if you have a read timeouts, you need to increase the readable timeout and readable interval (because they are equal 1m0s by default). If you have writeability timeout, you need to increase the writable timeout as well.
Maybe worth to take a look on:
setting the node to full in config.yaml fixed it for me it seems. 52h online
will do more testing when online recovers in 2 weeks
what line did you edit?
which line exactly i have to edit to increase the timeout? there are some with “1m” and i dont know which one exactly
The space the node uses to the space the node occupies. So its full.
and no ingress=no timeout error.
At first I did the same as you, tell it that the node is full in the config.yaml. But in the end I decided to roll back the version and thanks to that the node has continued working, I recovered 100% from suspension and I have almost filled 2TB in node since I made the changes. In a few days the node will be full. Then I’ll update node again to the latest version and we’ll see how it goes.
If all goes well, I’ll start migrating it to a larger hard drive or create a new node with better performance (we’ll see).
You must look for these variables in the config.yaml file and increase the time