Then you need to use 1026:100 instead of 1000:1000 and also update the owner to the same user and group recursively for folders with the 0:0 owner.
You also may update the owner to 1000:1000 too, but you will lose the access without sudo.
The other way is reverse - update the owner to root (0:0) and remove the --user 1000:1000 option.
1 Like
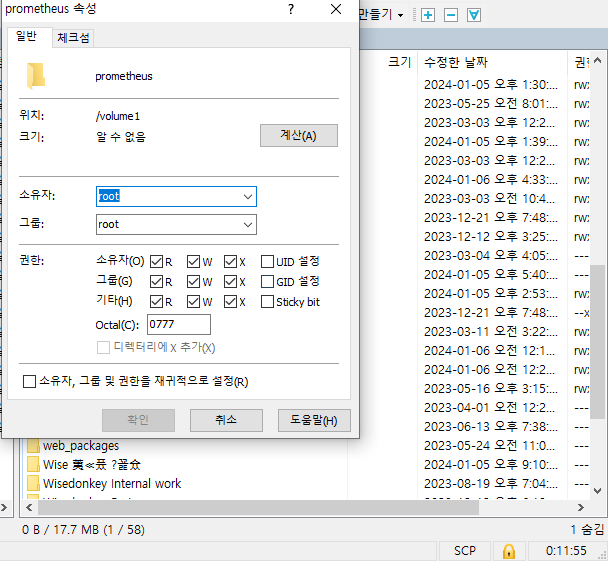
It’s a permission issue. It’s resolved by adjusting permissions with winscp!
I’ll have to try the method you suggested!
Thank you ![]()
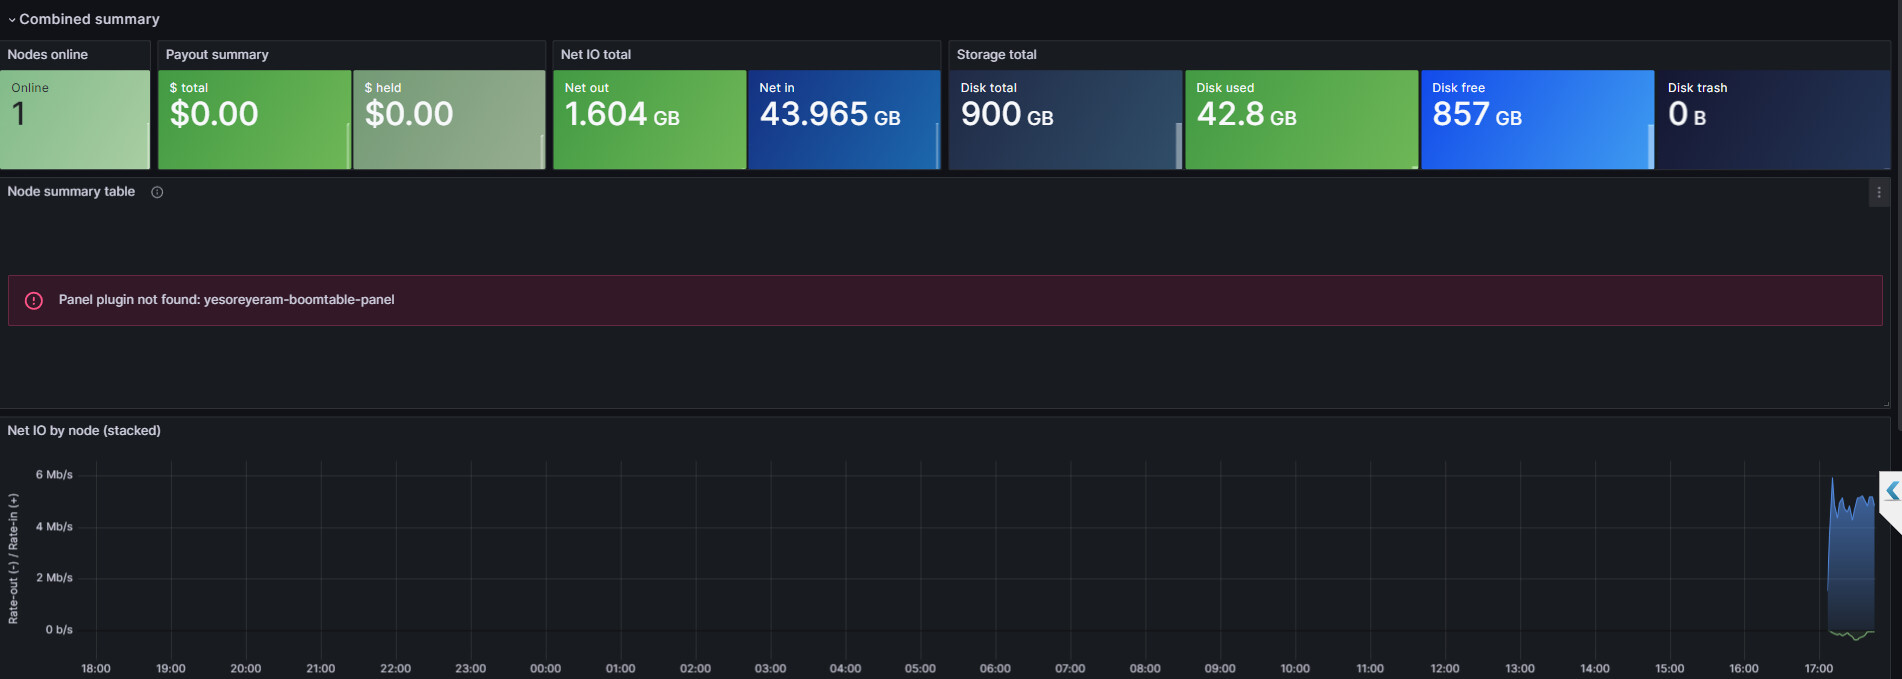
Anyone know how to fix the plugin issue with “Panel plugin not found: yesoreyeram-boomtable-panel” like shown in @Dr.Ko’s post?
Do you have tried this?
Yep, and it is installed.
✔ Plugin yesoreyeram-boomtable-panel v1.3.0 already installed.
I found another Dashboard that I haven’t seen on here and it seems to be working without using the boomtable panel…
4 Likes