Hi everyone,
I originally made this little tool for myself to keep an eye on my storj storagenodes and their traffic. I decided to clean it up a bit and share it in case it is useful to other node operators as well.
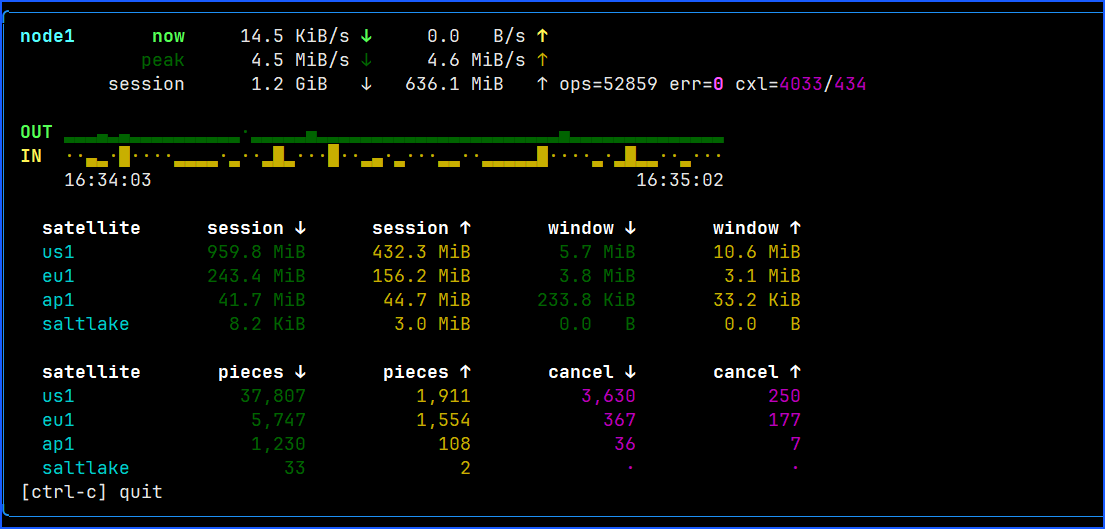
tails the storagenode node.log and displays a real-time terminal dashboard with:
- current and peak upload/download bandwidth
- session bandwidth and operation counts
- per-satellite traffic
- piece counts
- canceled transfers and errors
- live bandwidth sparklines
It can run directly with Python or as a Docker container, and you can run one instance per node.
GitHub:
It’s still a small personal project, so feedback and suggestions are welcome.
Hopefully someone else finds it useful too. 
Here is screenshot from my node: