So, I’ve installed Diagnosis tool in my syno and been observing it.
Mainly, iotop. I can see in accumulated mode that there are some processes not related to storj that stand up. “postgres: walwriter” pops up and also the inevitable multi “kworks” processes. One surprising process has been also showing up, “synosnmpcd”, even after disabling SNMP.
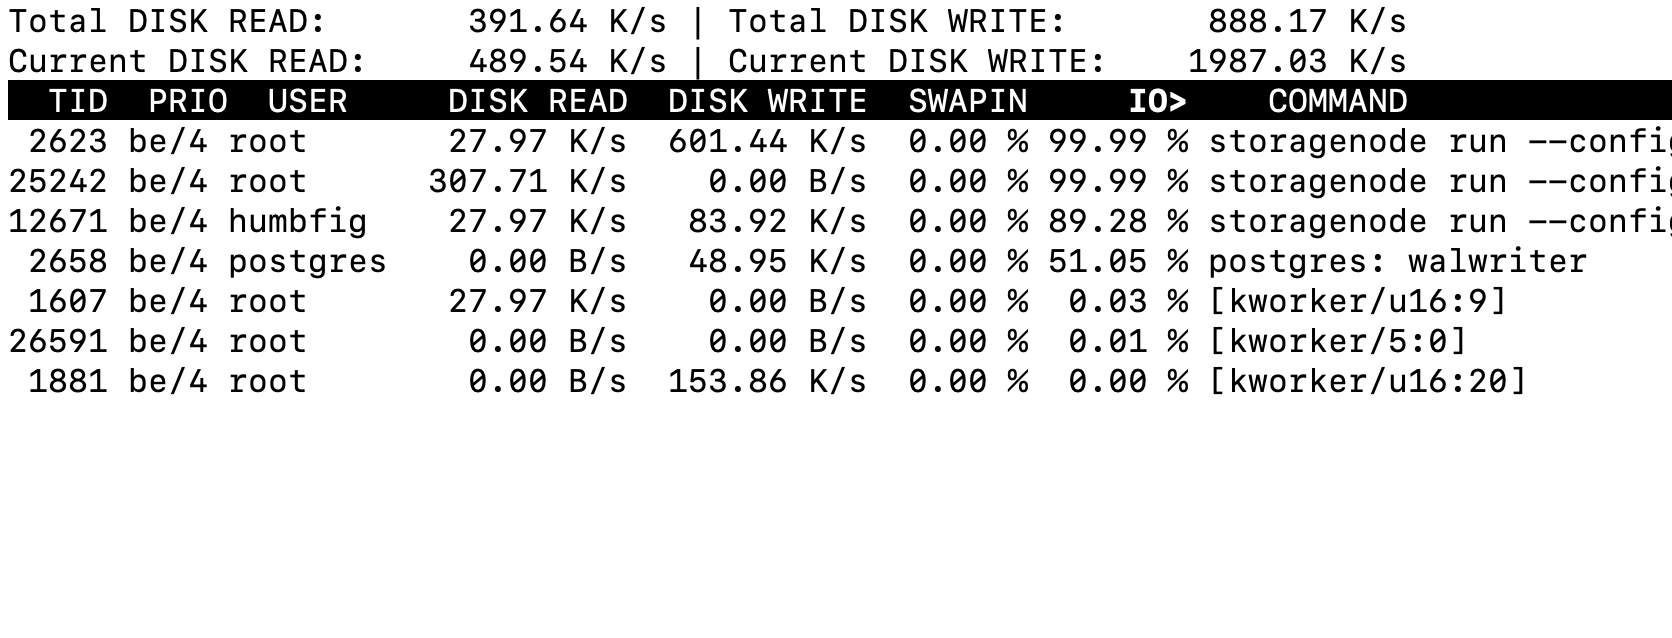
All things considered, from my observations, the over-IOPS come from multiple “storagenode run” commands. This can observed on the following iotop output in accumulated mode:
I’m not sure every node piece dl/up should start with 99.9% or not. I don’t know what “IO%” means. It’s a fraction multiplied by 100. What’s on the numerator? What’s on the denominator?
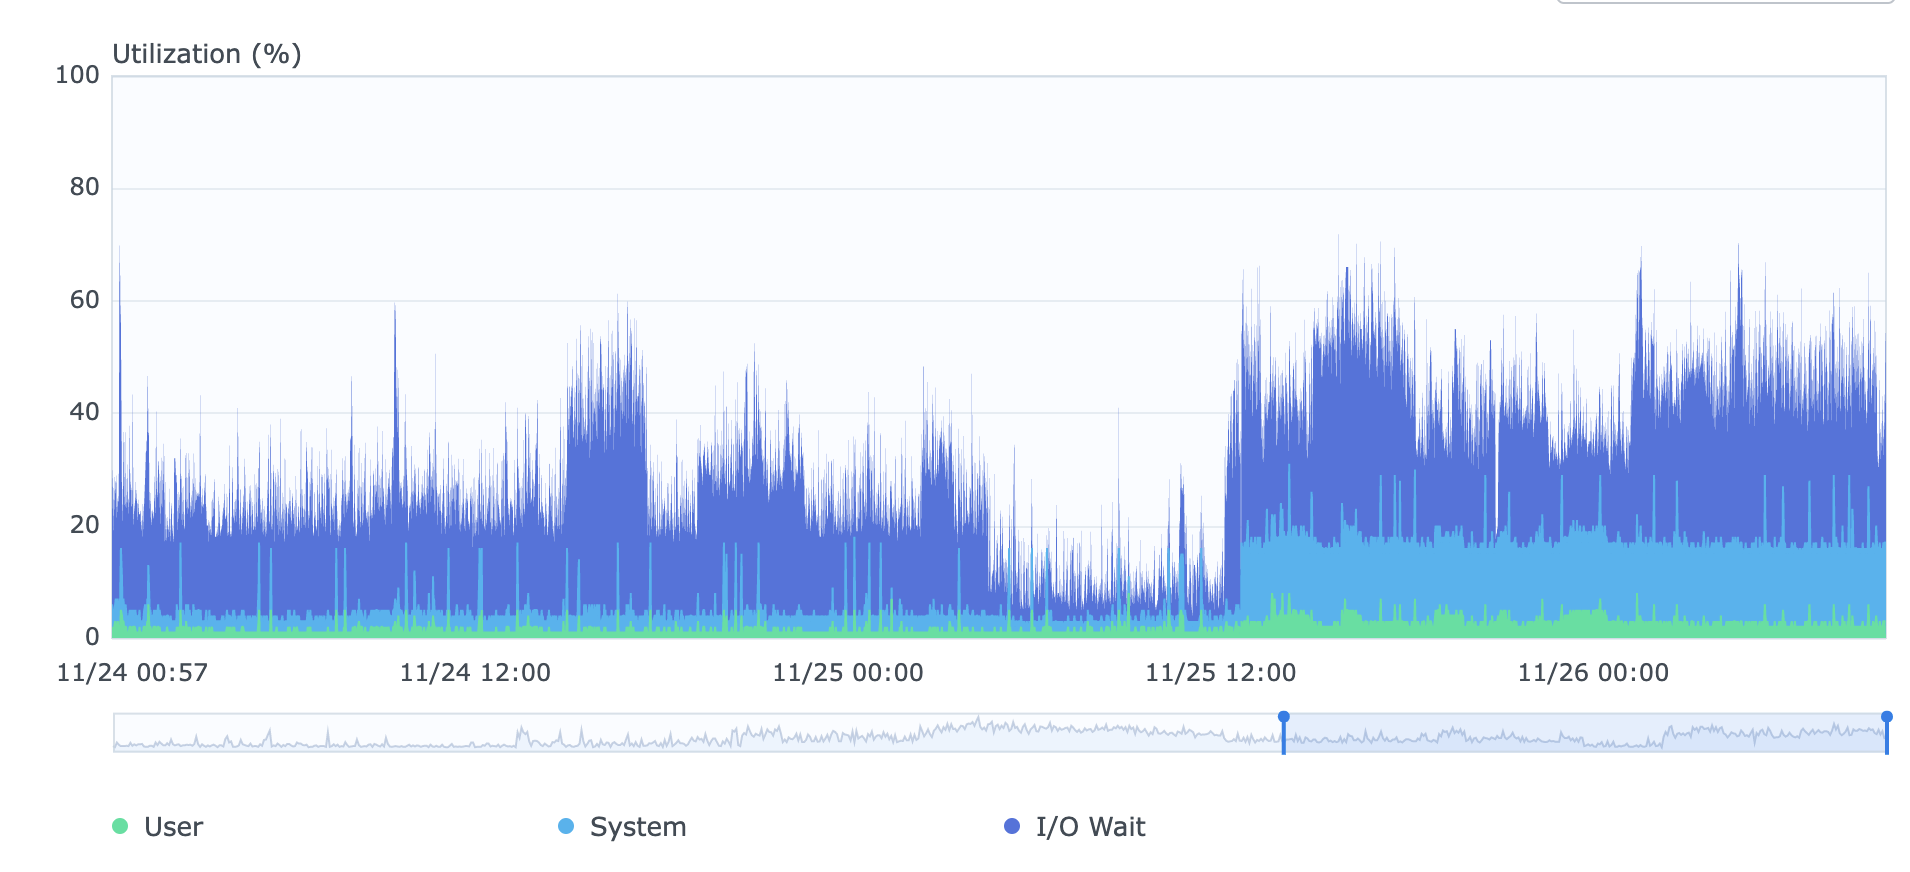
I know that at the same time this is going on the CPU is overwhelmed waiting for the disks,
So, I don’t really know what’s going on here… but something is. My egress success rate is down to 93% on both nodes.
Also, this has been a ~1TB ingress month. In 1 hour about 80% of the month gains was deleted!?!?
If you guys can help…
This morning I noticed the disk lights on my syno flashing for ~2 seconds, pausing for ~1 second. Immediately I knew the “CPU I/O wait time” armageddon was over (I didn’t write “IOPS armageddon” because the syno is doing about the same IOPS it was doing before). Apparently, this was the usual behaviour after a restart of the nodes (1-2 days of too high CPU I/O wait times), although with ~15% more “system CPU” that usually is not there.
I found that the process “synosnmpdc” is related to the app “Resource Monitor”. As soon as I tried to plot the historical data of CPU usage, the process took over nearly 100% in iotop IO and the CPU wait times went through the roof again. I disabled the usage history in the app. Real time plotting is ok concerning the CPU wait times.
So, I guess I’m good until I get the v1.66.3.
Success rates are climbing.
Now, for maybe a different “problem” which might not even be a problem. I started this month with my oldest node holding 6.36TB. Ingress is almost 600GB. I now hold 6.46TB. Approximately 400GB were deleted when it upgraded to v1.67.1. I restarted the node and got v1.66.1 again. The deleted amount vanished. I had more than 6.8TB again (can’t recall the exact number). 1 day later I got back to what I now hold. Strange…
Such sudden decrease in the node size could be related to Storj purging test data, which is alright. But the other node was created in September, vetted only in 3 satellites, and was also hit by a sudden decrease.