I have noticed a memory increase in my node recently. Anyone else?
I used to barely break 2GB on a Debian VM and now have a full GB+ increase.
I have allocated 4GB of RAM which was plenty before.
Reason I ask, is that I don’t see a matching increase in data/bandwidth/IO.

My node doesn’t use more than 250MB.
1 Like
UPDATED !!
I see a similar trend - about 2x the memory usage before update to 21.1.
I don’t graph historical data for this metric on the SN, so it’s just a “trend” based on manual inspection.
UPDATE: My statement was premature - been keeping an eye on it for the past few hours… there is no indication of higher memory usage on my nodes. If any it’s the same or lower 
My nodes are anywhere in the range 35-450M memory usage, depending on usage patterns.
@rml52 - BTW, why don’t you have a look at the processes running on your instance to identify the memory hogging processes? 
Yeah I looked at top last night and storagenode was holding the top spot and nothing else was close to it for cpu or ram usage.
Looks lower now but still higher than recent weeks:

You storagenode process uses 40,408 (40 megabytes) of memory out of it’s reservation of 413,200. So it would seem thats not the one using up your memory.
You can get “top” to sort it’s list by memory usage, by adapting it’s settings if you launch it with:
top -o %MEM
or for some distributions
top -o MEM
Look for the VIRT and RES columns. They are normally listed in kilobytes.
Example output from one of my nodes:

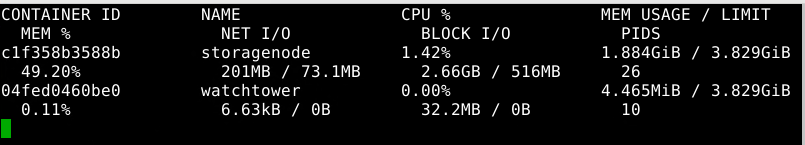
Alternatively, you can ask docker about the details with:
docker stats
Example output:
Happy hunting 
1 Like

1 Like

Something is not consistent on your screenshots;
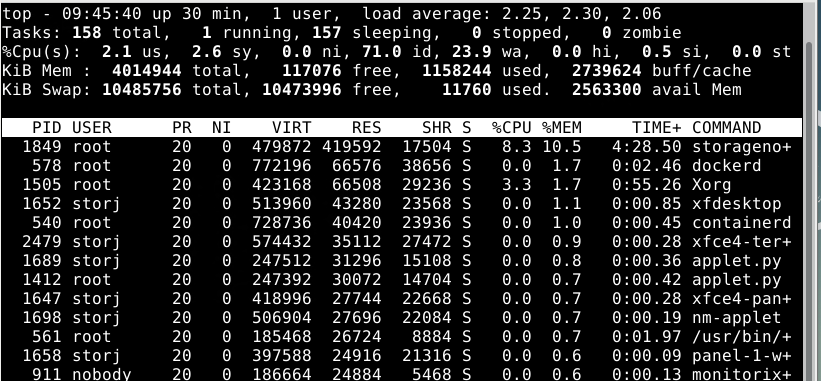
In top output, your SN uses 38MB in the first one and 419 in the second one.
In docker stats output, it uses 1884Mb? (this is quite excessive…)
However, looking at the usage on you second top, it looks just fine - but you have alot of other processes running using up resources aswell… do you have X11 / GUI on that debian server? The processes listed on the top screenshot uses ~450MB for X and ~450MB for storagenode. That seems reasonable ?
I’m not sure I have alot of good ideas for troubleshooting the very high memory usage on docker stats… slow IO perhaps? How is you IO-Wait for the underlying disks?
The first screenshot was of top -o %MEM this morning
The second screenshot was after a reboot. At first, after doing the docker run command, it was around 2 but gradually climbed way past 3 in less than 30 mins.
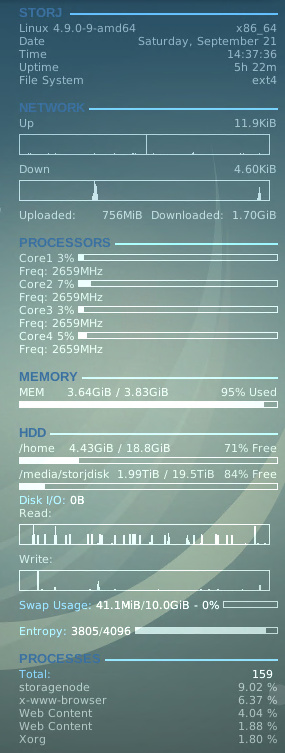
The system is a PowerEdge R510 with 10 x 4TB Seagate Constellation SAS disk in a RAID 6 (not all for storj). A Debian VM with 4 processors, 4GB RAM. and yes GUI.
After the reboot, I did not start anything but the SN and an auto start of Conky for graphical reference.
I typically have a broswer session open watching Monitorix but did not open that this morning after the reboot. I also usually have a terminal open for the dashboard, but with the GUI dashboard now, I didn’t open a terminal nor a browser session. So besides what is needed post reboot, conky, and docker/SN I have nothing running.
For months I was only using around 1.8-2GB of RAM, earlier in the week it climbed past 3 and stayed.
For months I had the above open, GUI, conky, browser, terminals x4, docker/sn all at 2GB.
I do not know how to test disk IO. Is there a terminal command or something?
You can check your disk io-wait with top as well - it’s in the “wa” field in the cpu line, but it’s probably better to use something like:
iostat -dmx 2
It’s part of the sysstat package in case it’s not installed (apt install sysstat).
It’ll show you detailed info for each device - example for a software raid:
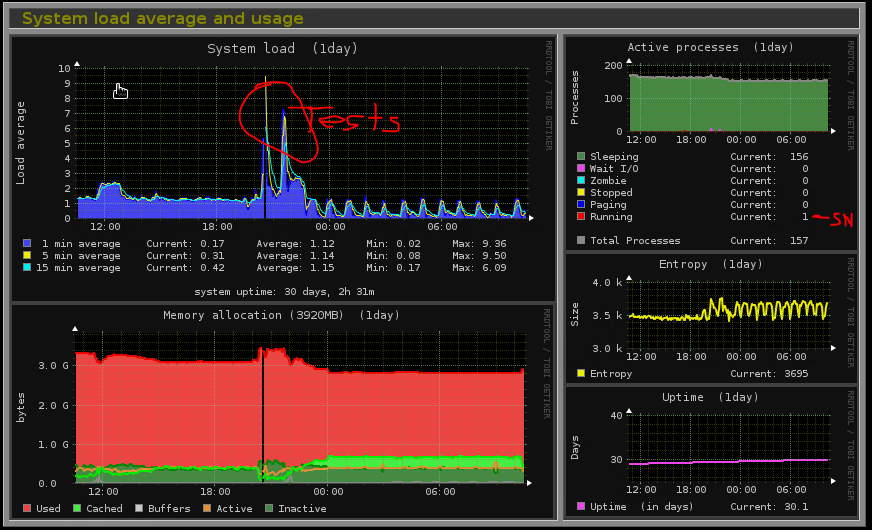
I just opened the browser and loaded the monitorix graphics

The pink is IO Wait

Seems that the reboot fixed this but don’t know cause or why other things like top and conky still say maxed out???
One thing that could influence your data as well, is the fact that traffic on the network is quite low the past couple of days. Right now, mostly deletes and a few down-/up-loads going on.
Not sure how to proceed from here to troubleshoot… keep an eye for changes other the next day to try to understand a pattern?
Alternatively - someone with more in-depth knowledge on how to troubleshoot or get details on the actual storagenode container could help out here ? Still seems odd to me with the high memory usage on the SN container.
Perhaps @BrightSilence or @Odmin could spare a couple of brain-cycles on this?
Hi @mike!
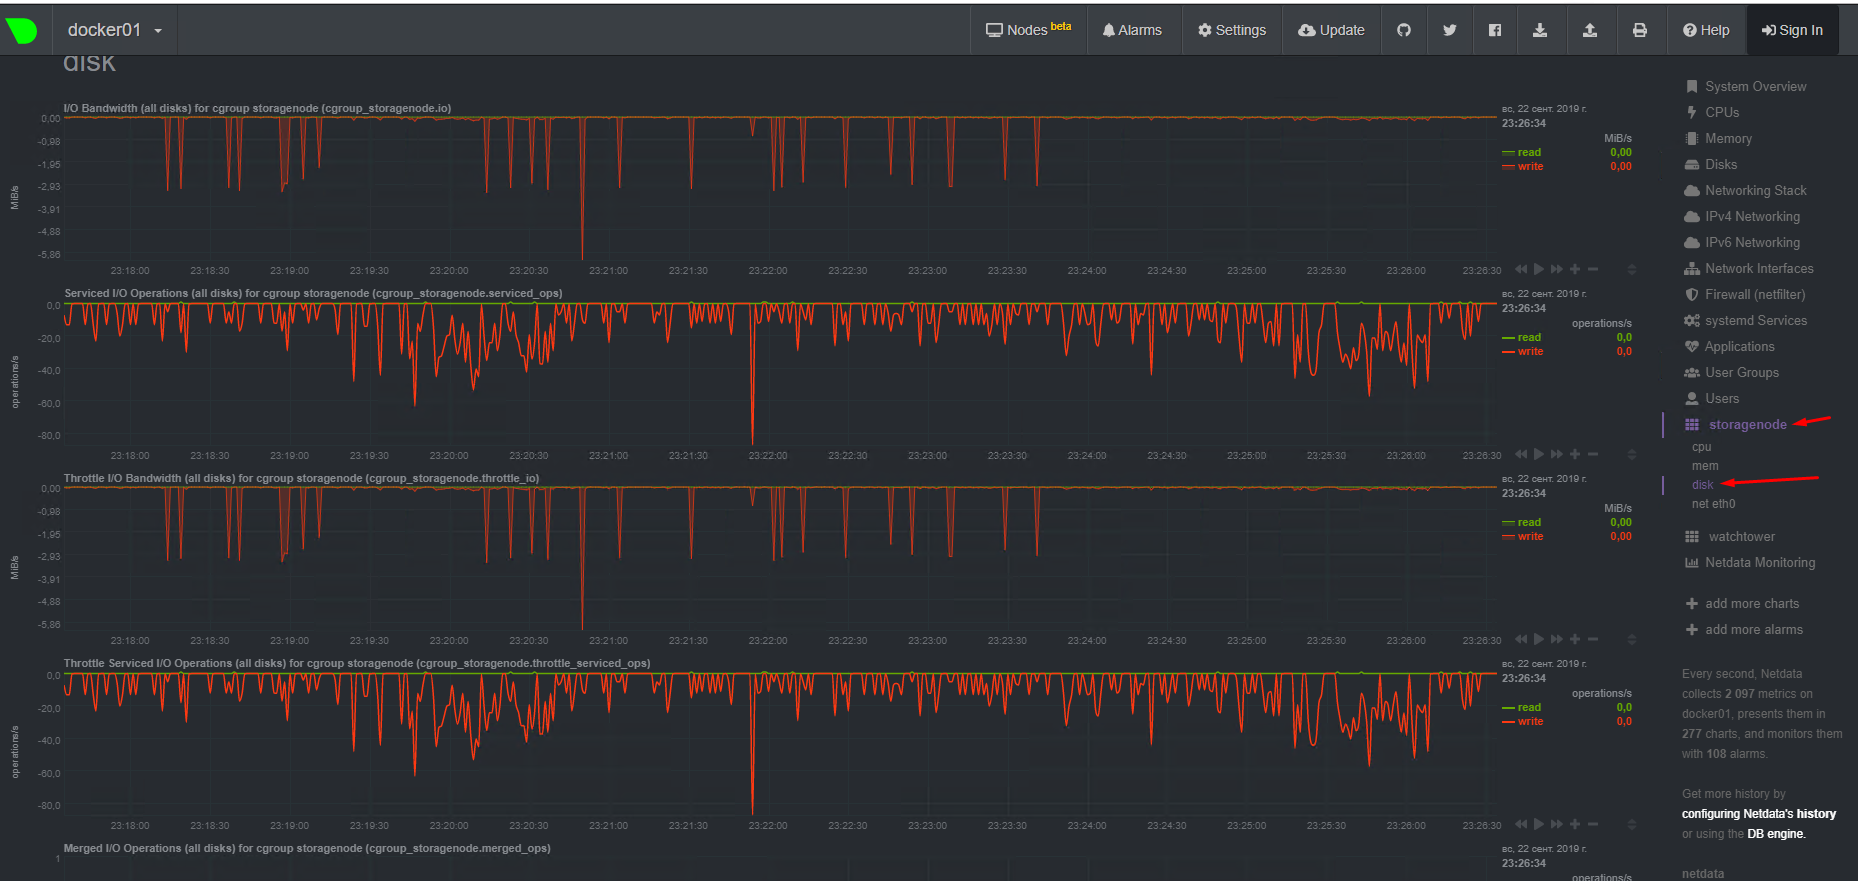
I can also recommend use netdata (but make some changes for collect long term data for a one day)
Add it to /etc/netdata/netdata.conf
history = 86400
Then activate ksm (save memory for netdata metrics, memory deduplication):
echo 1 >/sys/kernel/mm/ksm/run
echo 1000 >/sys/kernel/mm/ksm/sleep_millisecs
Now you will collect all data of your system and containers, when issue is came we can see where and who did it (memory consuption)
2 Likes
Ok So i installed netdata.
I changed the history config

Where and how do I do the ksm?
just copy to console line by line:
echo 1 >/sys/kernel/mm/ksm/run
echo 1000 >/sys/kernel/mm/ksm/sleep_millisecs
It will work untill reboot
k. ran the commands but don’t see anything?
What screenshots do you need?

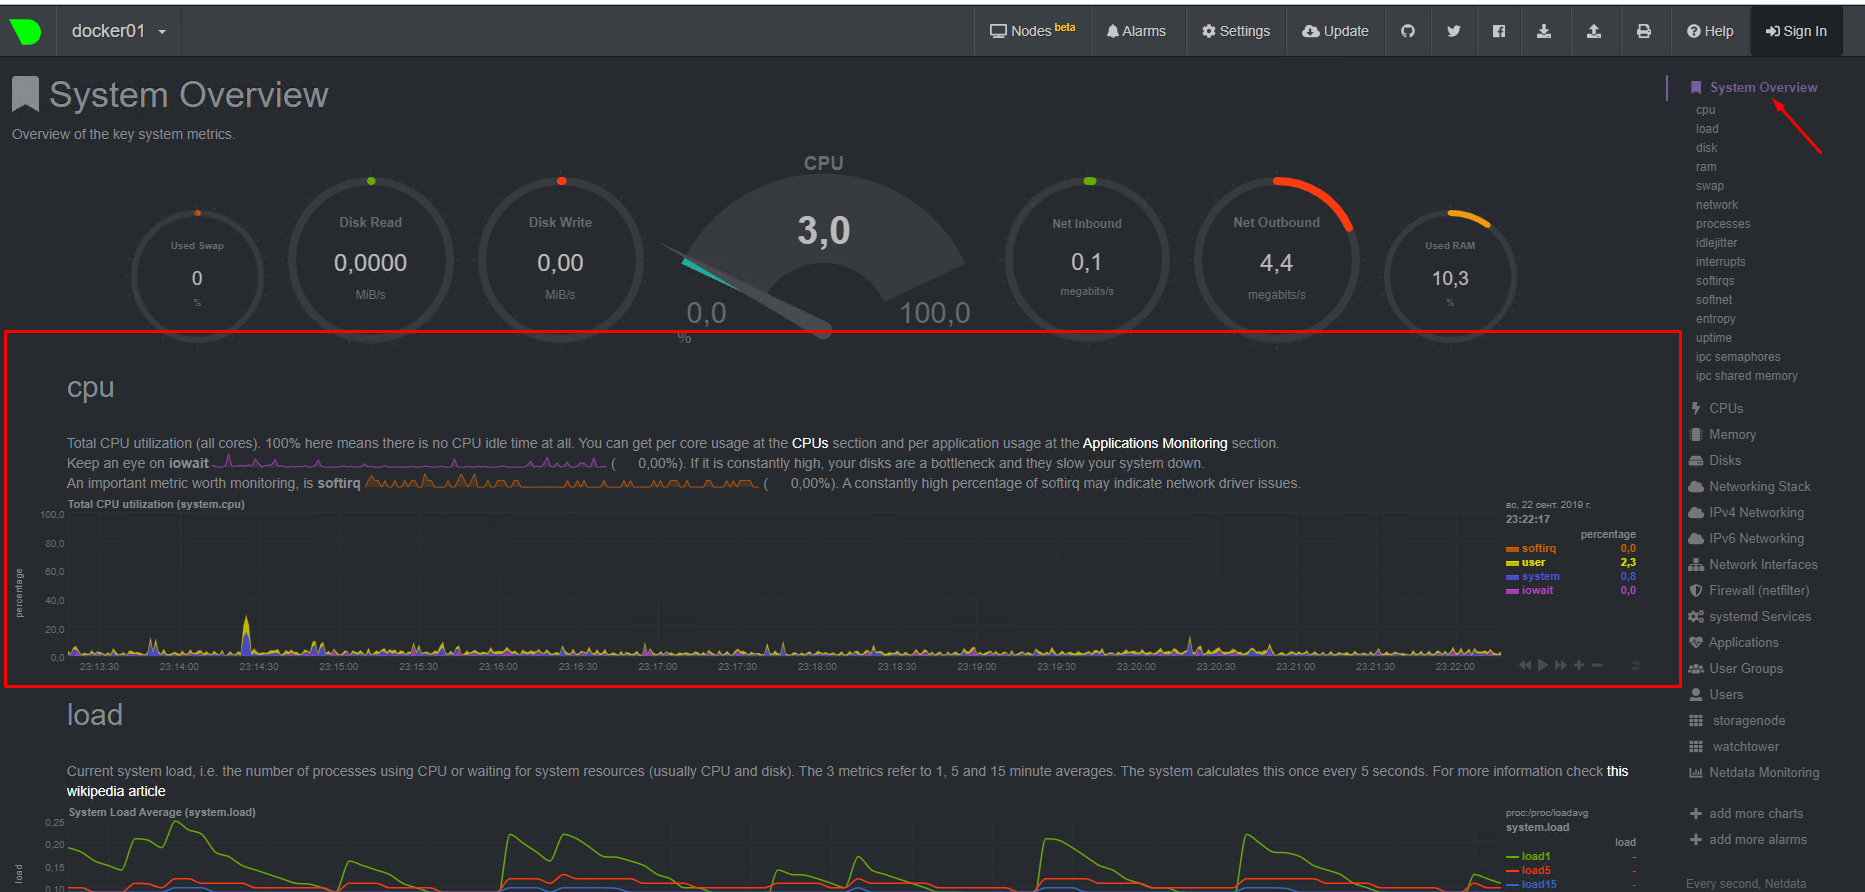
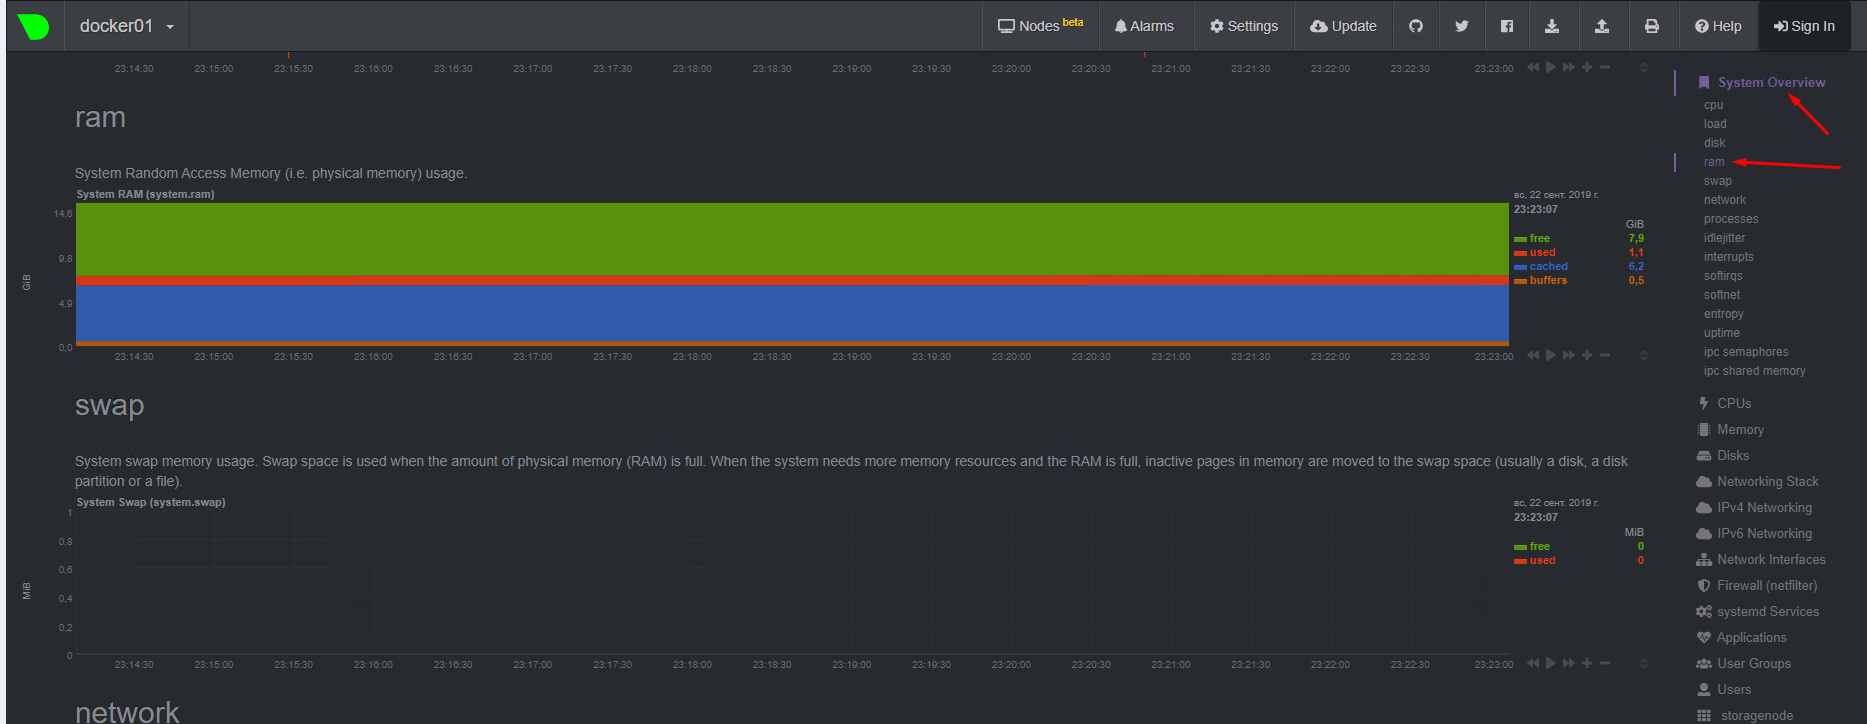
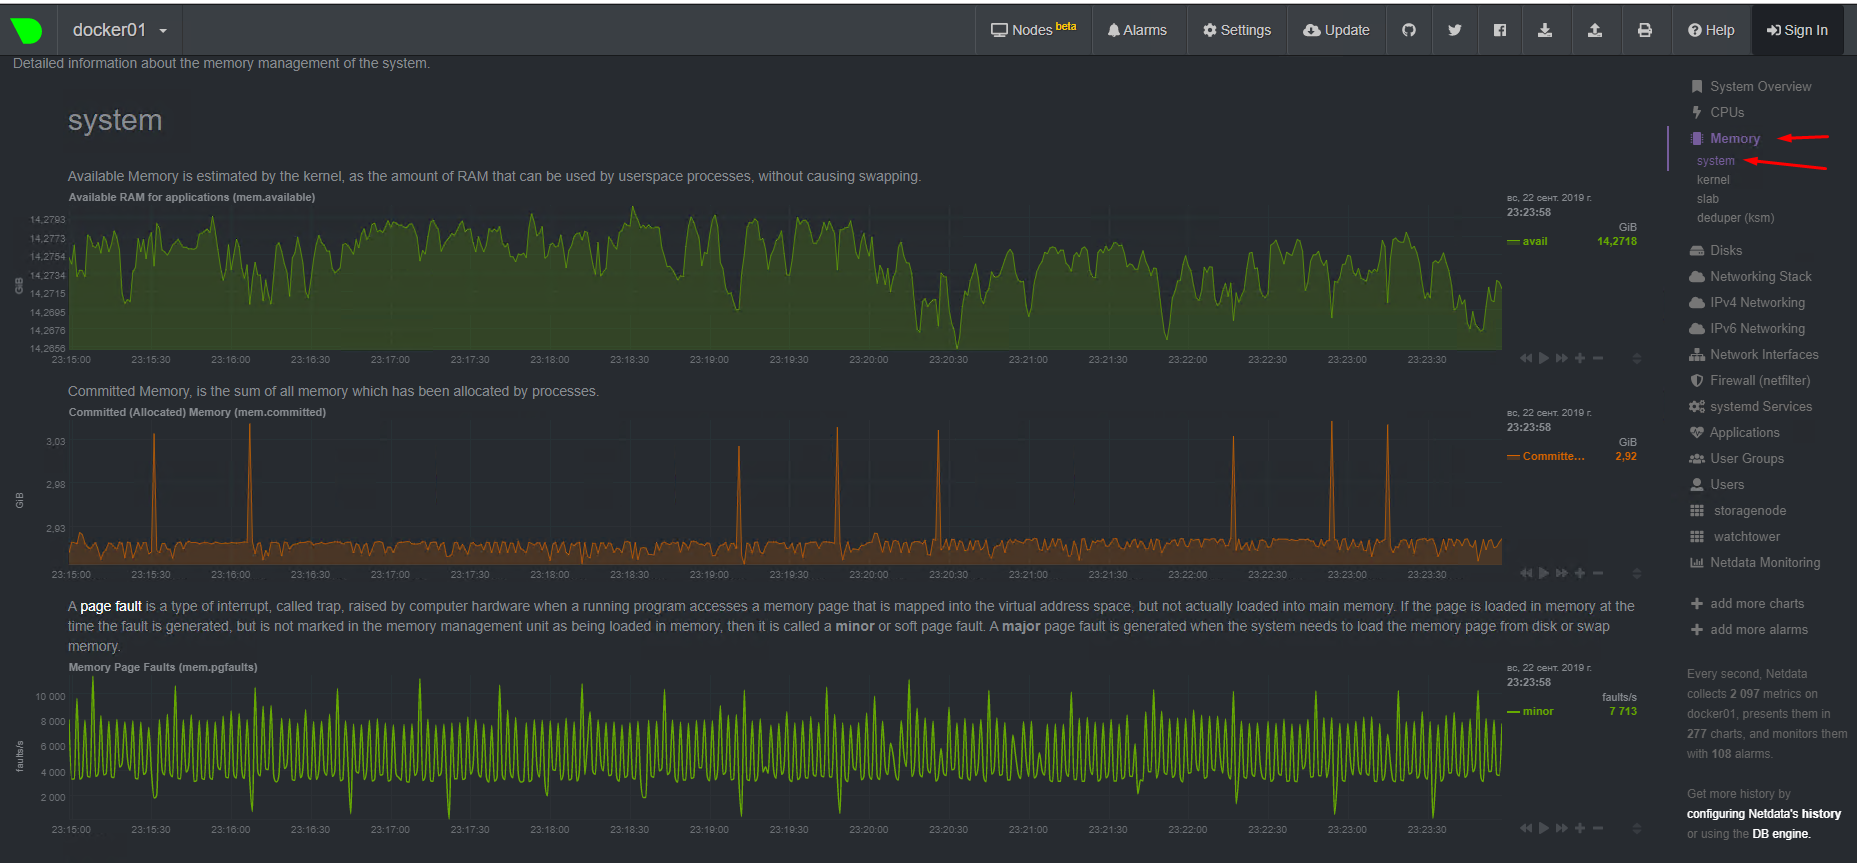
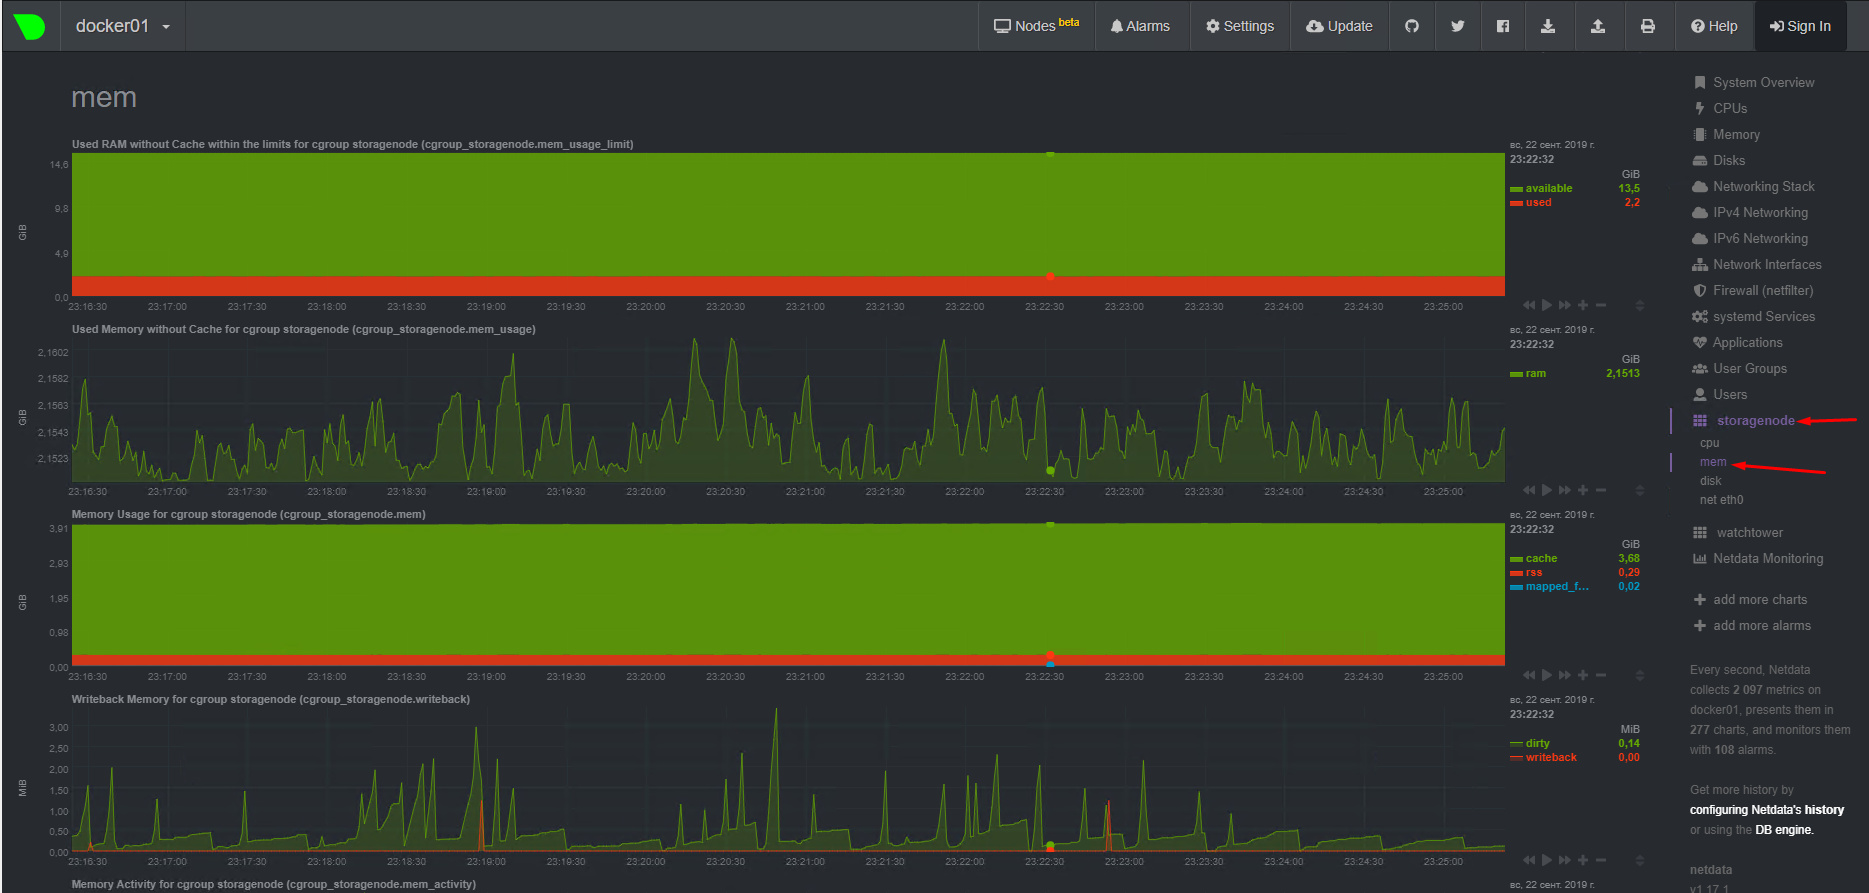

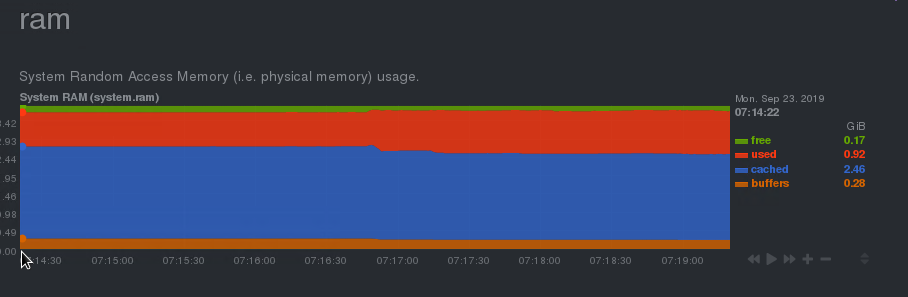
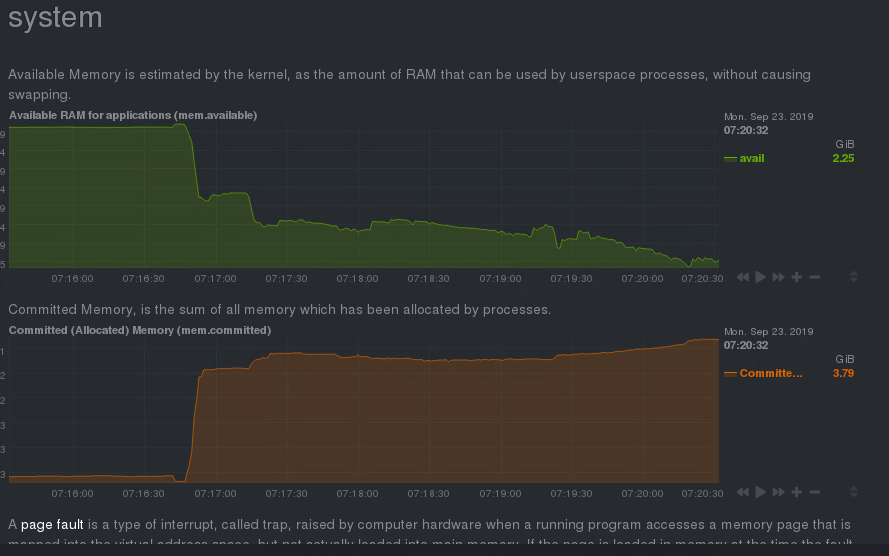
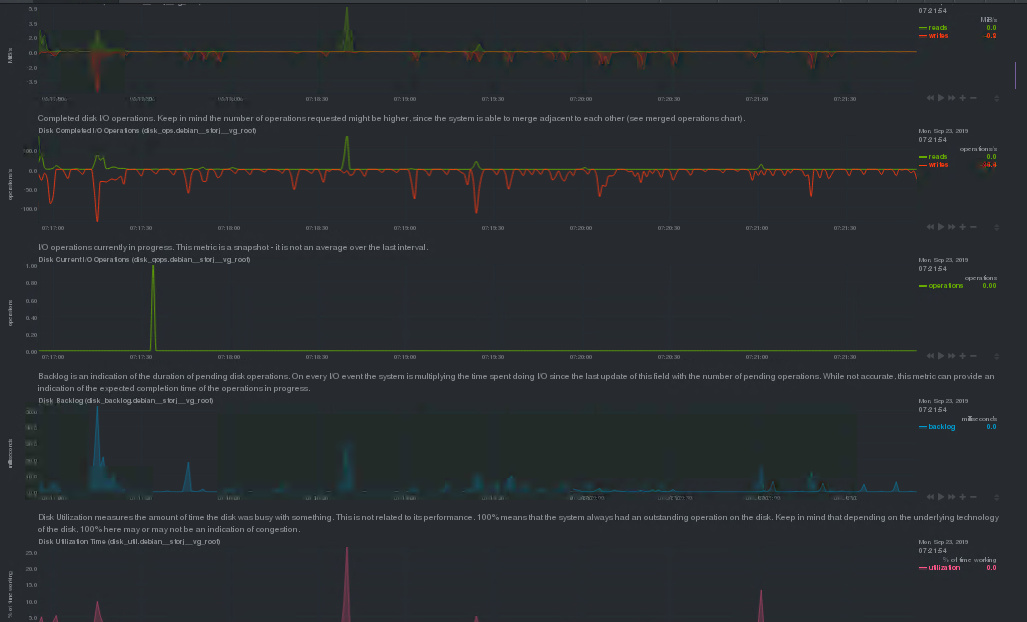
Memory consumption looks like normal, you have memory cache 2,46 GB that can be flushed to disk at any time. But I pay your attention for your disk performance (iowait time during login), I think it can be the root cause of your problem. When tests is running and memory cache is full it will try flust data from memory to disk, and if disk system is slow as result you will have high iowait time and out of memory issue.
Also I see that you using graphics enviroment on this machine, I reccomend using storagenode on linux without graphical enviroment, it will save huge memory and resources.
At this point I reccomend do nothing, and wait when issue is came, then catch the same screenshots and we will see it. (press CTRL and and turn the mouse wheel for zoom in/zoom out graphs)
1 Like