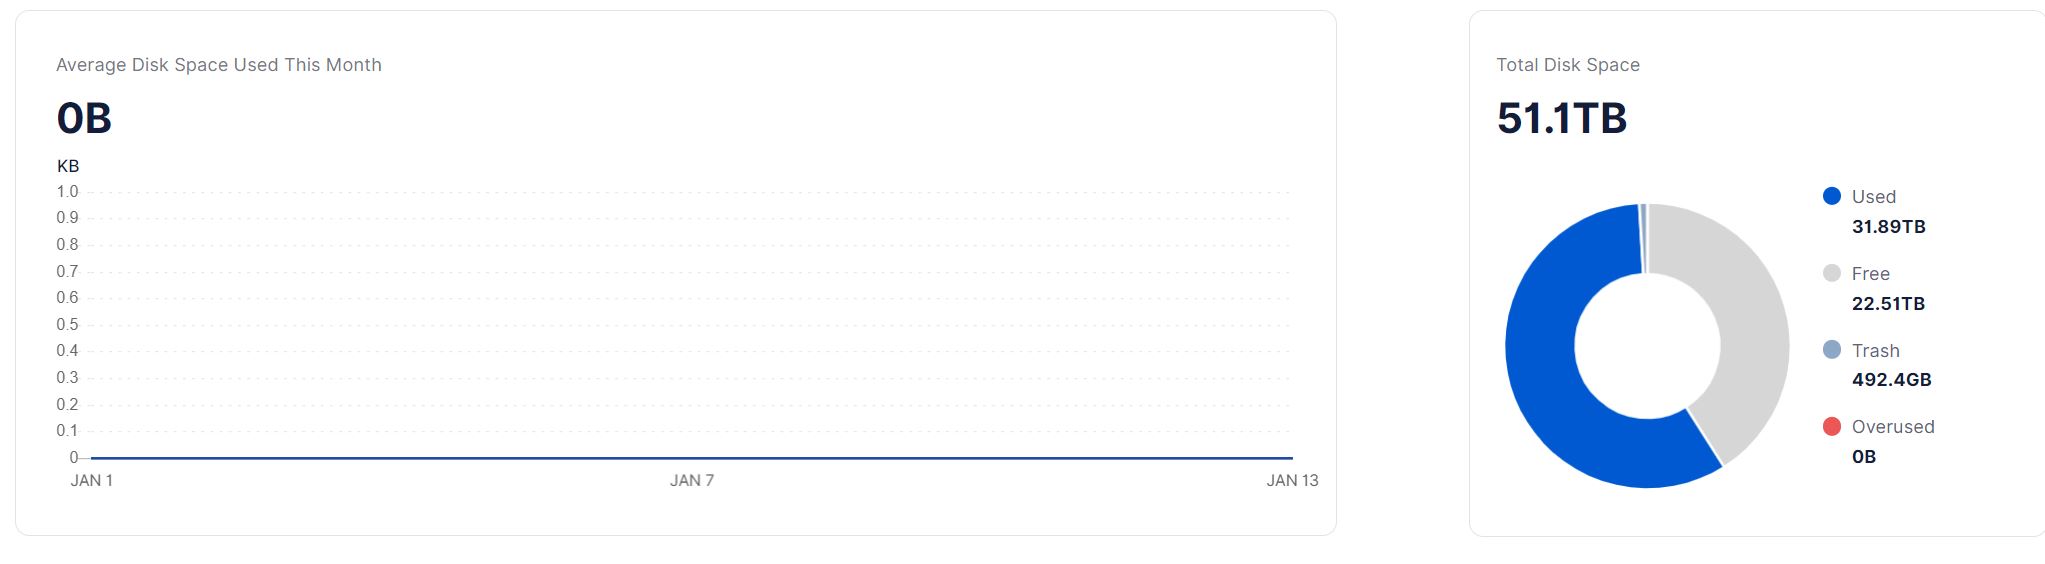
Hi, I have another two problem with new multinode.exe 1.70.2 on windows 10 pro. One I don’t see the average disk used this month. I restart the exe but nothing. I downgraded to 1.69.2 and i see the graph. other problem is the total space of nodes that is not correct. The space used is real but free is not real, it’s minor.
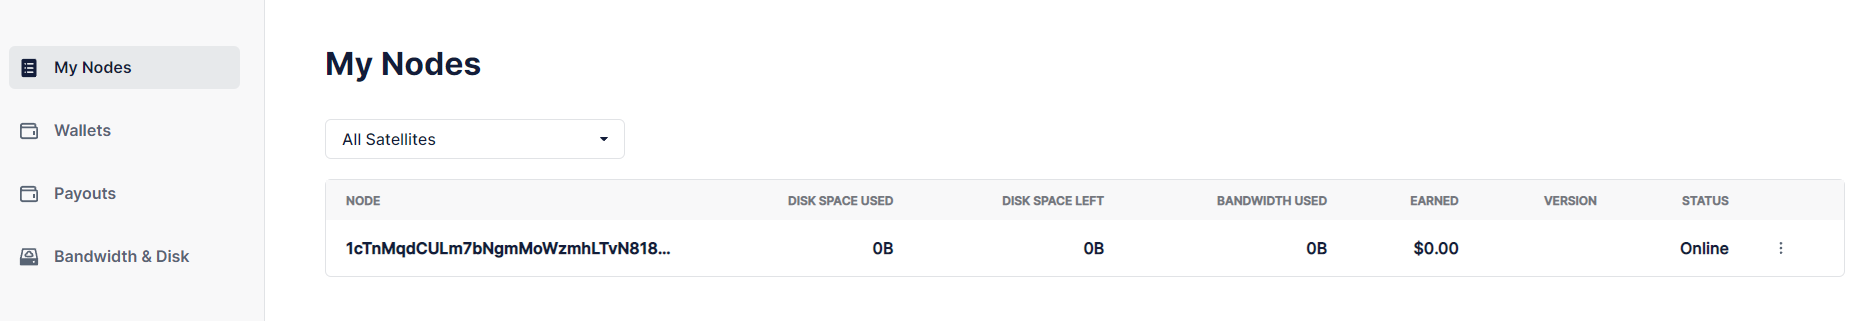
A little update on my problem. If I set up a completely new multinode dashboard and then add just the one storagenode that is causing problems, I don’t see any stats under “My Nodes”.
Hello and thank you for your reply. I appreciate it.
I tried the multinode dashboard in versions 1.69.2, 1.68.2, 1.67.3 and deleted the master.db and config.yaml each time under …AppData\Roaming\Storj\Multinode.
Unfortunately, still no statistics under “My Nodes”.
The problem is that my other nodes with the same version work fine. Only this one does not.
I suspect something is wrong with this one node, but I have no idea what. It would be really helpful if the multinode dashboard had a lot more logs of what is happening to see what is not working.
for the storagenode that is causing problems, I get:
ERROR nodes:service nodes/service.go:193 ListInfos earned error {“error”: “payouts: sql: Scan error on column index 0, name "comp_at_rest": converting NULL to int64 is unsupported”}
Is it possible that one of the SQLite databases of my Storagenode is broken?
When I don’t add earned.Total, I get statistics for everything else.
Thanks for reply, but the other problem? You have a reply? I don’t see the average as you see in the photo. I downgrade to multinode.exe of version 1.69.2 and i see the graph.
Thanks.
I do not have a reply from the team, they do not work on weekends. But I guess that the latest version of the multinode dashboard is not compatible with the old storagenode’s version.
Well, it seems that it was indeed a corrupted database. I stopped the node, deleted all .db files and restarted the node. Now it works fine and shows the statistics in the multinode dashboard. Of course, the statistics are wrong at the moment, but that’s fine.
I guess that not displaying the statistics was a feature to indicate that something is wrong with this node.
Thank you very much for your valuable time, @Alexey.
One last note: The orders.db was quite large at 622M. I’m not sure if this database is supposed to be that big.
This database is not used anymore to store orders, the orders now stored on the disk as files in the orders subfolder in the config location by default.