We have been hearing some feedback on the dashboard and I have been trying to incorporate user feedback into the next iteration of the node dashboard.
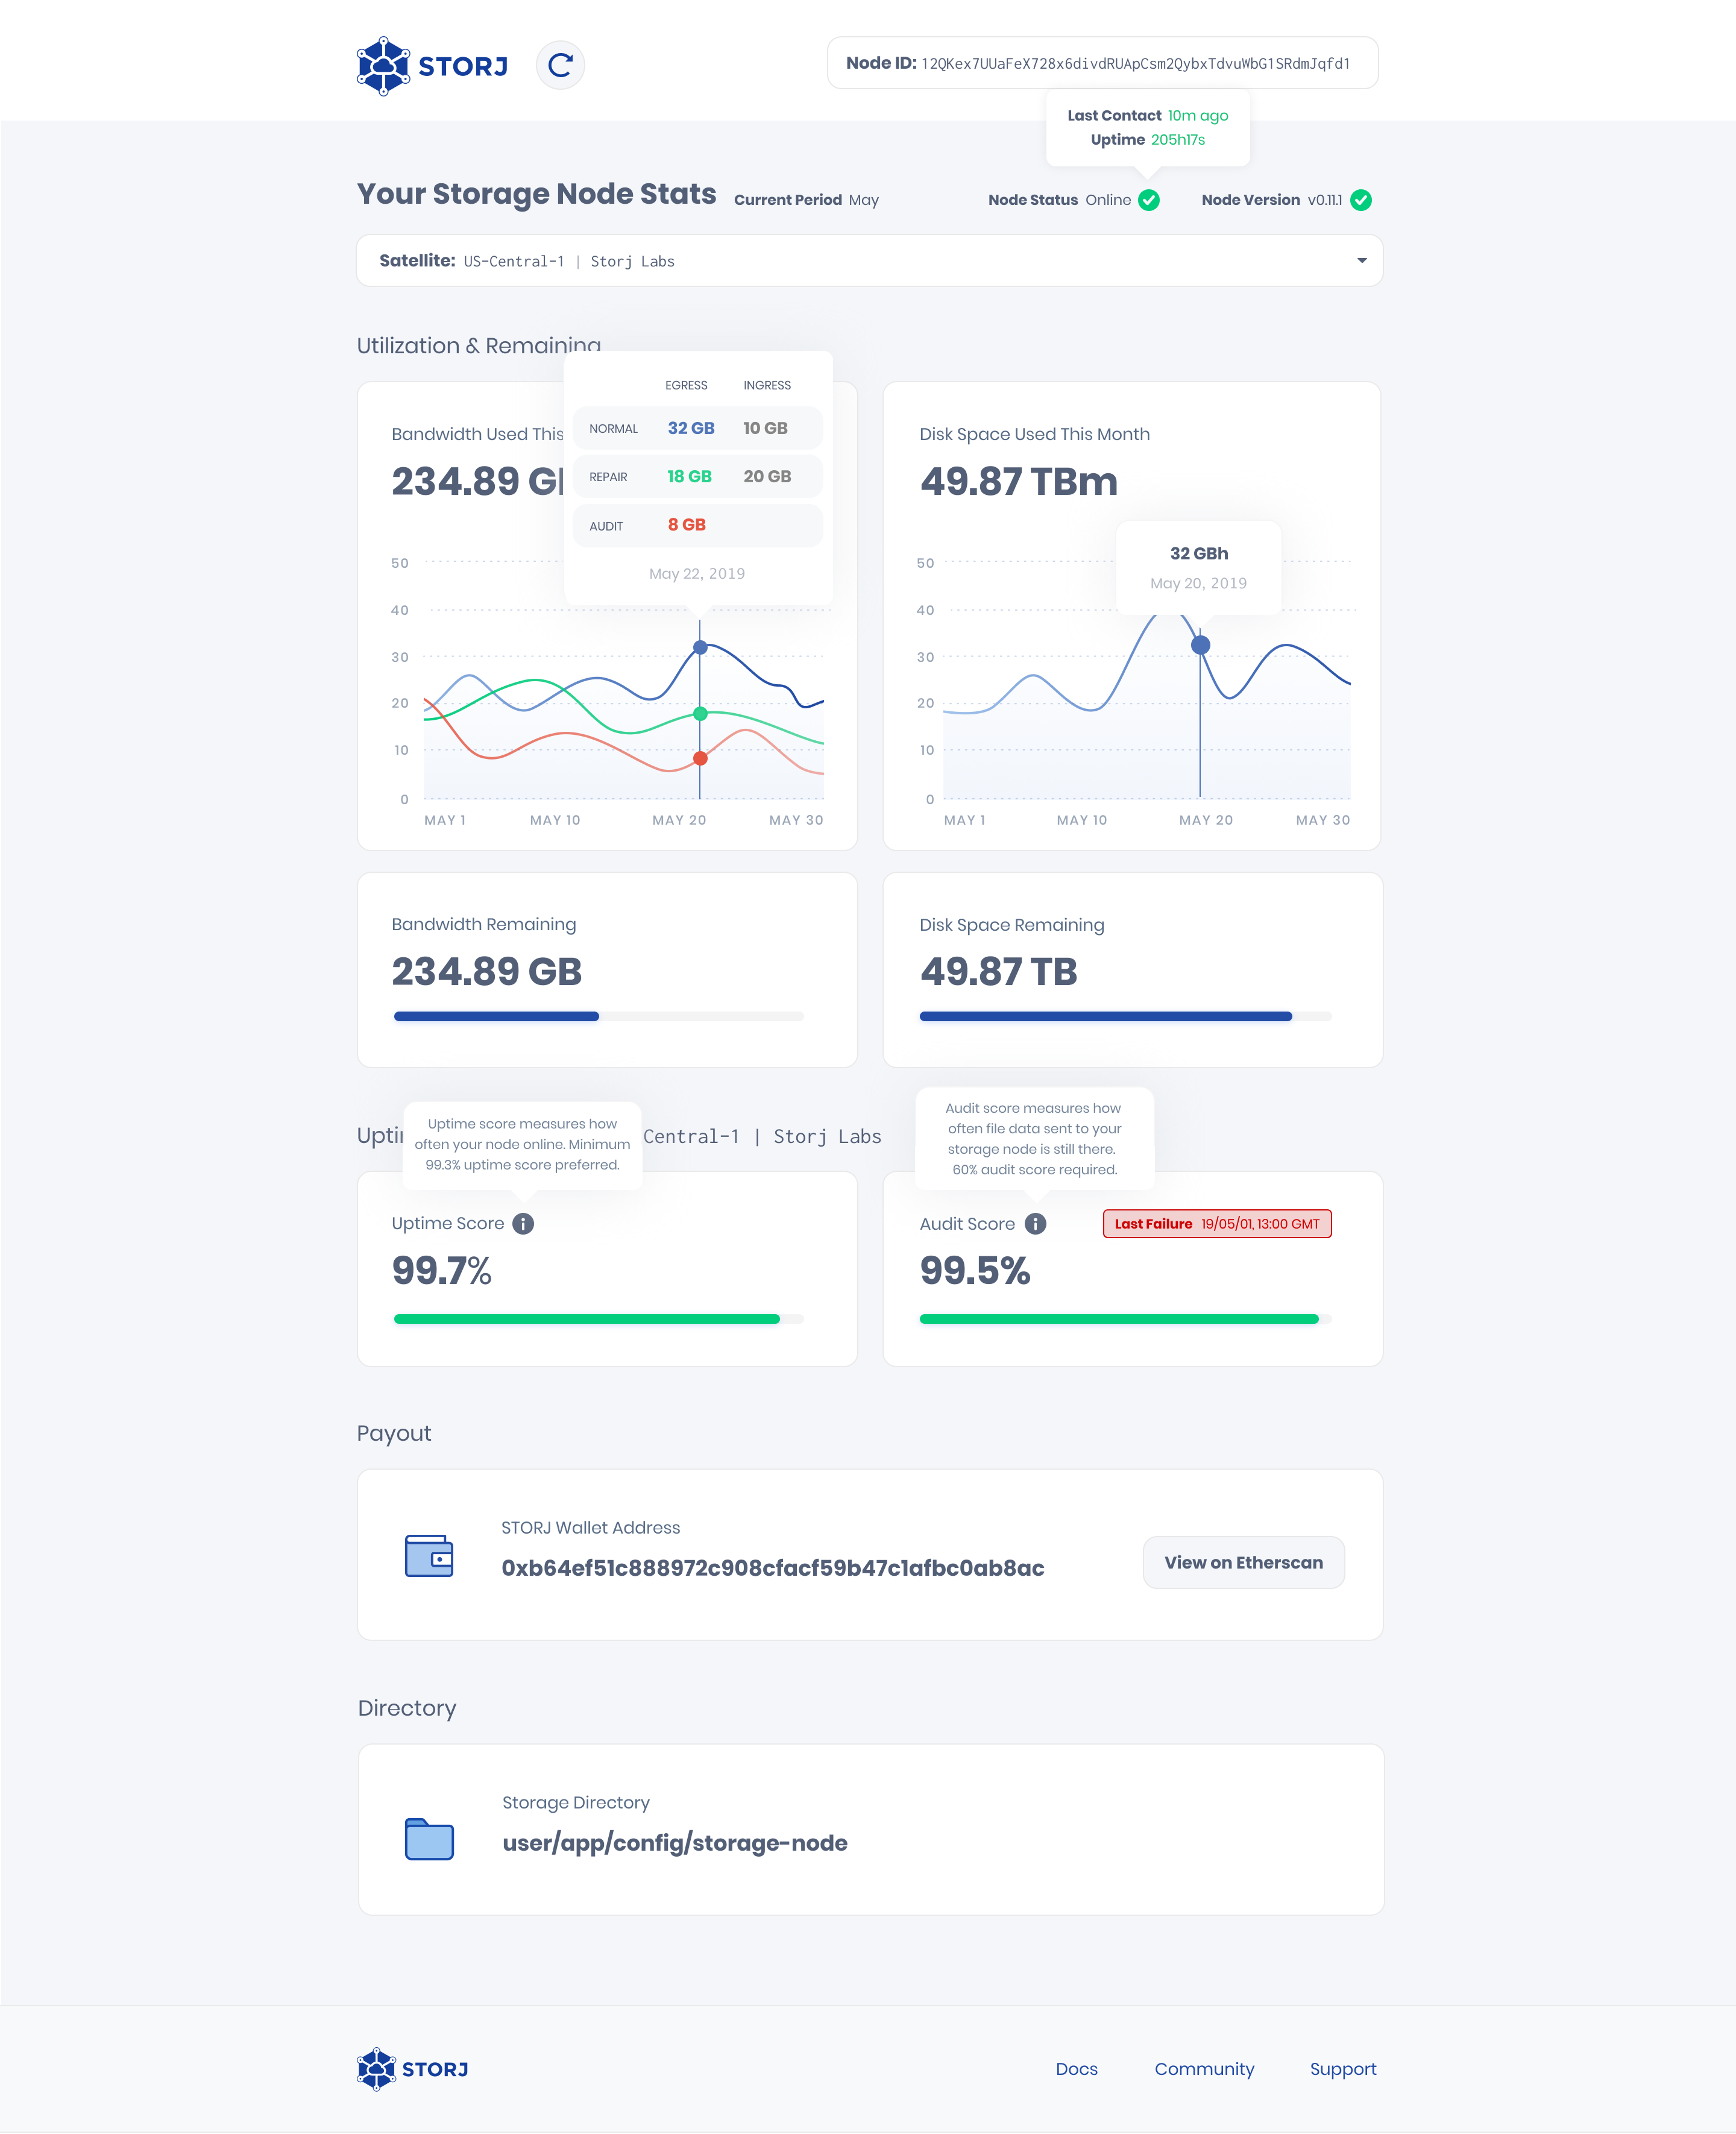
Online status – providing more information on the actual status via hover.
Make graph easier to understand – add the Y axis to more easily see your stats.
Unit of measure for disk space – since payout is measured in TB*month , show this value.
More info on uptime and audit – show a status bar to understand if you’re doing well or not, also show the last audit failure to understand what could’ve went wrong. Also, updated definitions.
Storage directory – the location of your storage directory displayed on the dashboard.
A few specific questions I’d love answered:
What do you like?
What do you dislike?
What is missing?
What is unexpected?
What is confusing?
One thing I’d love is to have a separate “node dashboard” docker image that hosts the front-end web application, and be able to configure it with a list of node endpoints (ip+port) to pull data from. (I would configure all of the nodes to be in a VPN so that the node API port is still not exposed to the public Internet.) Then have the web dashboard not only allow me to view each node’s stats in one place, but also display aggregate data from all nodes.
For those of us intending to manage 5+ nodes, this would simplify things dramatically.
An estimate of MTD earnings would also be nice to have. Mixing in the above idea, per-node and aggregate estimates would be useful.
I miss a unified overview of how my node is doing across all satelites. I don’t like to click through each satelitte just to see how my uptime and audit rates look.
Understandable per satellite information is important, but the effort for checking if everything is OK should be as minimal as possible. Aka 1 page load, 1 look
I liked the Audit rate and node uptime %'s in a previous build. That was a quick way to check if everything was ok.
If it’s possible to add in a simple link or notification when it’s updated
(i.e. a simple “Docker image updated on [insert date], here’s a link to the Changlog [insert Github Link]”)
The ability to show/hide elements of the dashboard, and break out all the different data ingress egress values.
The ability to show monitor log for serious “error” messages ( but filter out all the “untrusted peer” messages, so that only errors which affect the node are displayed. )
All the points for the next iteration are very nice!
In addition to the bandwidth graph Id like to see totals for ingress and egress of my node over current month. Without it its hard to guess the potential earnings from the “bandwidth used” as considerable part could be ingress traffic.
I love the updates in your screenshot, specifically:
Human readable names for the satellites
Switch to TBm for disk usage
Better descriptions for uptime and audit scores
I have a few questions though:
Do the score percentages mentioned still reflect the total uptime and audit successrate over the lifetime of the node? If so, the use of the term “score” is a little confusing. If not, don’t use a % sign as the scores are not a percentage.
Do the bars represent the actual score or is this just a visualization of the same percentage?
What I would like to see:
Please also display the node ID of the satellite somewhere. This helps with connecting ID’s we see in the logs with satellite names shown on the dashboard.
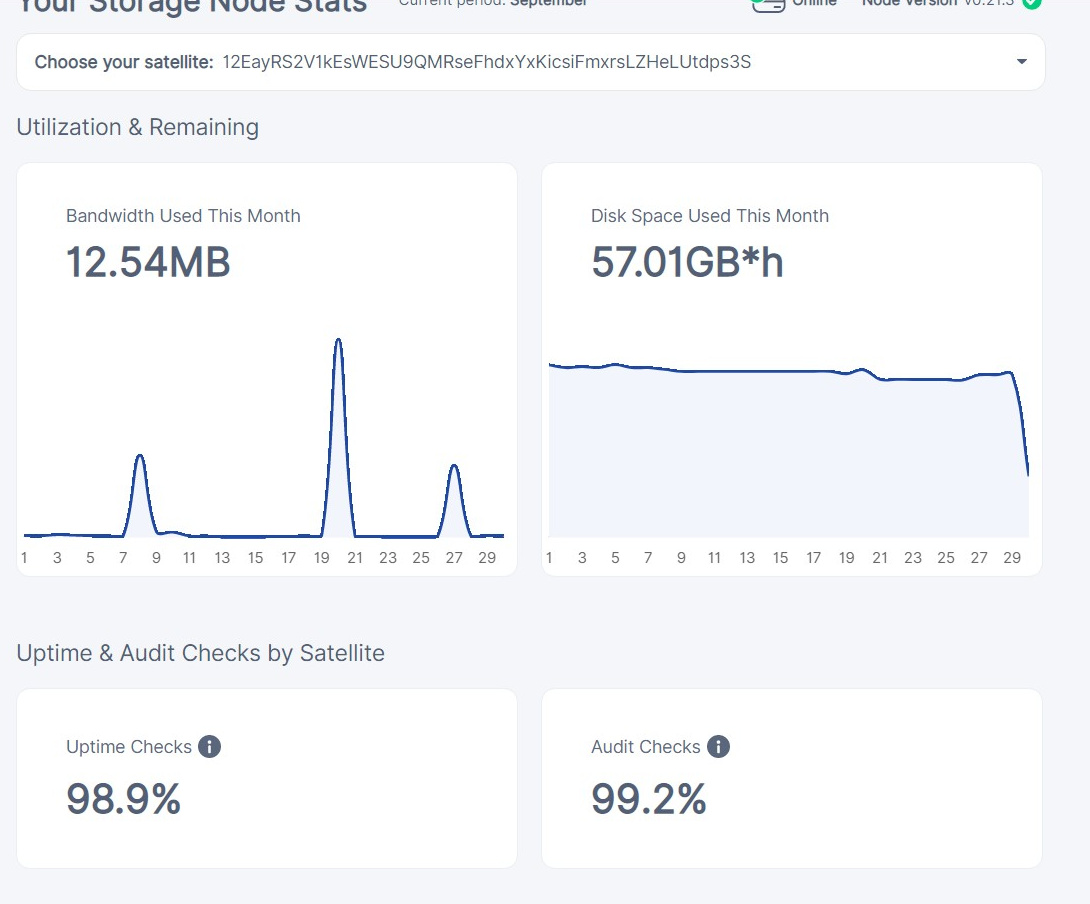
This is not visible in the mockup, but usually the amount stored on your node doesn’t change much over the course of the month. So the disk space used graph is almost always a straight horizontal line. It would be nice to change the bottom value of the y-axis dynamically so we can actually see some movement on that graph. You would have to omit the current day for this to work though, since during the day it will be much lower than previous days. This is a little misleading anyway since the graph always looks like you suddenly lost data on the current day.
While I like the separate lines for normal repair and audits, in practice the repair and audit lines will always be a straight horizontal line at effectively 0, since normal bandwidth is always several orders of magnitude bigger. Instead this graph is perhaps better used for splitting out egress and ingress.
Instead of GBh, show GBd (Gigabyte * days) for the daily numbers in the graph. This would align with the average stored for that day and make more sense to end users.
Dynamically switch units between MB, GB, TB, PB etc. Currently we see very large numbers for GBh. (Same goes obviously for GBm, GBd etc)
Show totals for uptime score and audit score on the “all satellites” page. Especially for all time percentages and last failure, which can easily be calculated across satellites. I realize that the actual scores are very satellite specific, if the bars are based on this you could either omit them or show the lowest score. (I would prefer showing the lowest score)
Add $ amounts and make my earnings calculator obsolete
Include a drop down to select the month (look up data for historic months). Payouts arrive throughout the next month and by that time the dashboard shows data for the next month and we have no easy way to verify. (Even my earnings calculator has to omit payouts for storage since historic data for that isn’t kept in the info.db)
If possible show payout transactions based on wallet address on the dashboard. On satellite specific pages show only payouts for that satellite. (I realize that last part will take some added info in the transaction metadata)
If the storage directory shows the path inside the container, it may be best to omit it for now as that can be confusing for the end user.
a histogram of failed audits/uptimes color-coded by satellite
(so you can guess/tell if you were unreacheable, or only the single satellite)
the storage/TBm as a stacked graph, so you can tell which satellite holds the data - and be able to click, to see the page and stats for that satellite in particular.
I noticed this as well. As you suggested, not showing the current day would work. Another option would be to prorate today’s value (multiply it by elapsed_seconds_in_day / 86400).
Sorry for misunderstanding, this is great feature, but my comment was about total number for current month for egress and ingress separated just like in cli-mode dashboard.