Hello,
I have 1 node running on a Synology NAS (RS422+ / DSM7). It has its own dedicated volume (with 1 disk) with nothing else on it. The DB is currently on the same volume as the storage itself.
It has been running fine for a couple of weeks with heavy disk util and occasional 100% period of utilisation, but rare shutdowns (1 every couple of days). Since June 18th (last update), it is constantly pushing the disk to 100% with high reads (I assume these are filewalkers). And the node restarts every couple of hours (10 times today so far) and 9 times yesterday.
htop confirms that storj is the only process significantly consuming I/O resources.

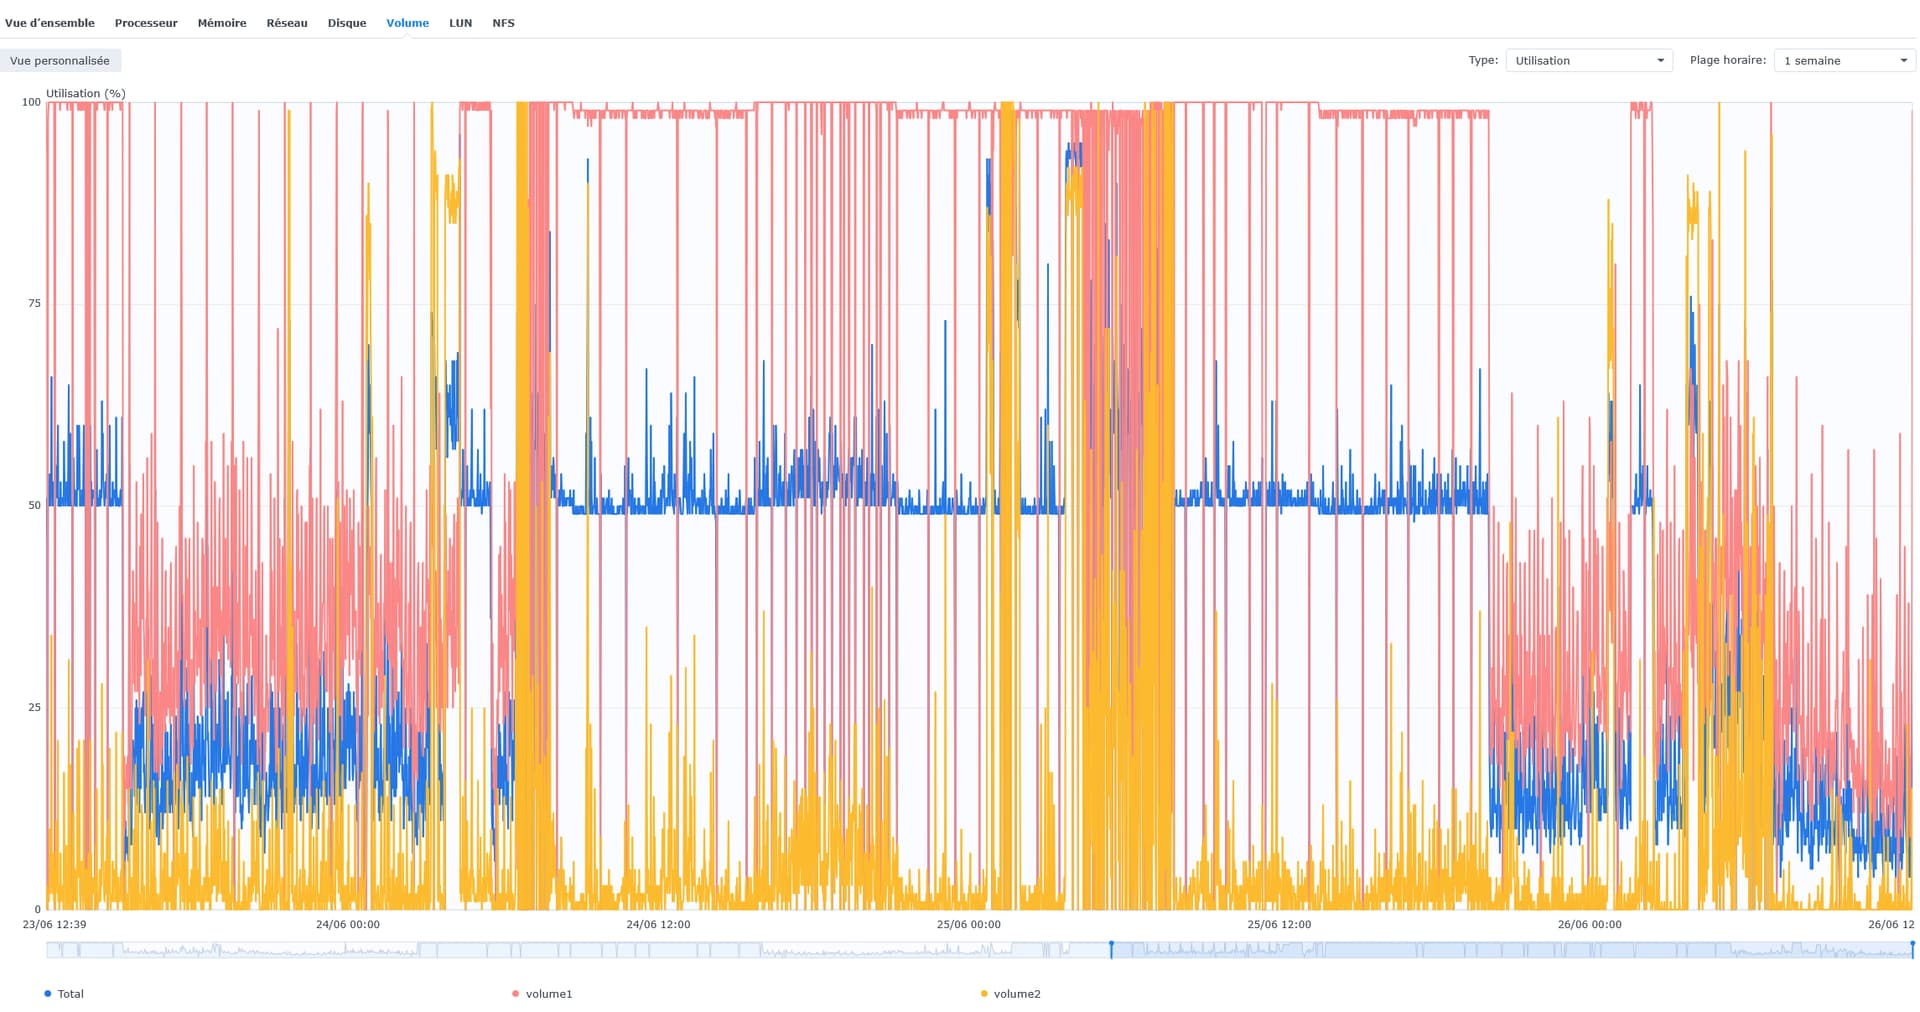
Here is the history of the volumes IOPS. The storage is on volume 1.

and Util:
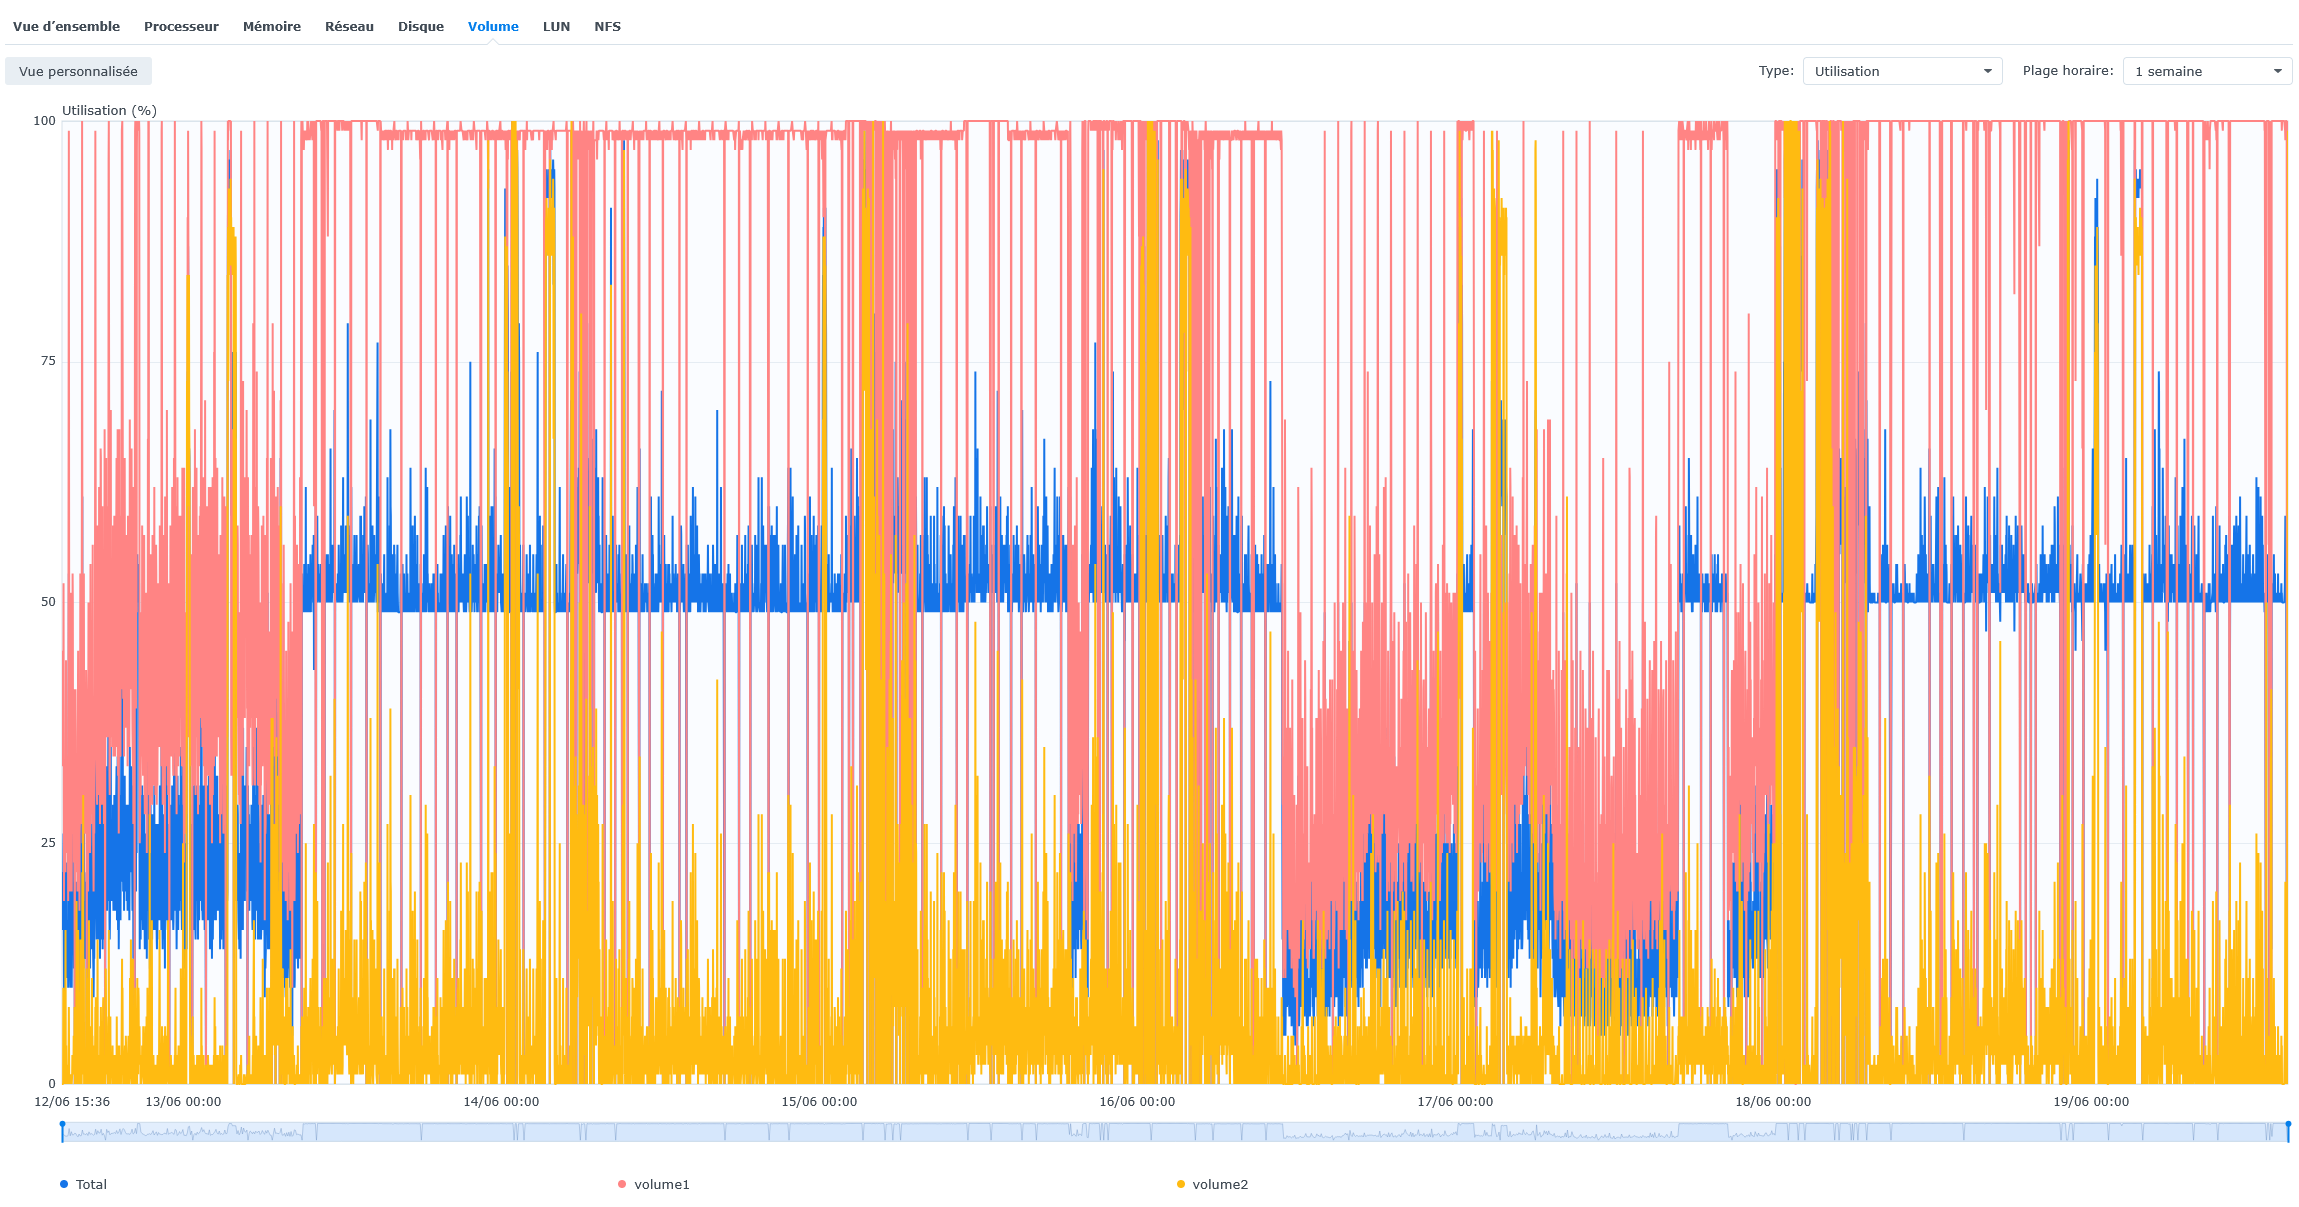
Even in the period 13th to 16th, the util was high but not quite 100% and the system was responsive.
I have greped the last 5k lines of log on “ERROR”, here is an excerpt (Full file)
2025-06-19T08:47:40Z    ERROR   db      failed to stat blob in trash    {"Process": "storagenode", "namespace": "ootPBOELroXWf0xsuCv41MDw9HqOpyYnUk3rbsAAAAA=", "key": "MEMBkZFQMFYjDH91cdfUaPUJdqoLbs7miqz8NAVHxUo=", "error": "lstat config/storage/trash/ukfu6bhbboxilvt7jrwlqk7y2tapb5d2r2tsmj2sjxvw5qaaaaaa/2025-06-11/gb/bqdemrkayfmiymp52xdv6und2qs5vkbnxm5zukvt6dibkhyvfa.sj1: no such file or directory"}
2025-06-19T09:11:36Z    ERROR   services        unexpected shutdown of a runner {"Process": "storagenode", "name": "forgetsatellite:chore", "error": "database is locked"}
2025-06-19T09:11:36Z    ERROR   piecestore:cache        error getting current used space for trash:     {"Process": "storagenode", "error": "filestore error: failed to walk trash namespace a28b4f04e10bae85d67f4c6cb82bf8d4c0f0f47a8ea72627524deb6ec0000000: context canceled", "errorVerbose": "filestore error: failed to walk trash namespace a28b4f04e10bae85d67f4c6cb82bf8d4c0f0f47a8ea72627524deb6ec0000000: context canceled\n\tstorj.io/storj/storagenode/blobstore/filestore.(*blobStore).SpaceUsedForTrash:302\n\tstorj.io/storj/storagenode/pieces.(*CacheService).Run.func1:104\n\tgolang.org/x/sync/errgroup.(*Group).Go.func1:78"}
2025-06-19T09:11:36Z    ERROR   pieces:trash    emptying trash failed   {"Process": "storagenode", "error": "pieces error: lazyfilewalker: signal: killed", "errorVerbose": "pieces error: lazyfilewalker: signal: killed\n\tstorj.io/storj/storagenode/pieces/lazyfilewalker.(*process).run:85\n\tstorj.io/storj/storagenode/pieces/lazyfilewalker.(*Supervisor).WalkCleanupTrash:196\n\tstorj.io/storj/storagenode/pieces.(*Store).EmptyTrash:486\n\tstorj.io/storj/storagenode/pieces.(*TrashChore).Run.func1.1:86\n\tstorj.io/common/sync2.(*Workplace).Start.func1:89"}
2025-06-19T09:11:39Z    ERROR   failure during run      {"Process": "storagenode", "error": "database is locked"}
2025-06-19T09:11:44Z    ERROR   failure during run      {"Process": "storagenode", "error": "Error opening database on storagenode: database: pricing opening file \"config/storage/pricing.db\" failed: context canceled\n\tstorj.io/storj/storagenode/storagenodedb.(*DB).openDatabaseWithStat:390\n\tstorj.io/storj/storagenode/storagenodedb.(*DB).openDatabase:367\n\tstorj.io/storj/storagenode/storagenodedb.(*DB).openExistingDatabase:362\n\tstorj.io/storj/storagenode/storagenodedb.(*DB).openDatabases:337\n\tstorj.io/storj/storagenode/storagenodedb.OpenExisting:302\n\tmain.cmdRun:67\n\tmain.newRunCmd.func1:33\n\tstorj.io/common/process.cleanup.func1.4:402\n\tstorj.io/common/process.cleanup.func1:420\n\tgithub.com/spf13/cobra.(*Command).execute:985\n\tgithub.com/spf13/cobra.(*Command).ExecuteC:1117\n\tgithub.com/spf13/cobra.(*Command).Execute:1041\n\tstorj.io/common/process.ExecWithCustomOptions:116\n\tmain.main:34\n\truntime.main:283", "errorVerbose": "Error opening database on storagenode: database: pricing opening file \"config/storage/pricing.db\" failed: context canceled\n\tstorj.io/storj/storagenode/storagenodedb.(*DB).openDatabaseWithStat:390\n\tstorj.io/storj/storagenode/storagenodedb.(*DB).openDatabase:367\n\tstorj.io/storj/storagenode/storagenodedb.(*DB).openExistingDatabase:362\n\tstorj.io/storj/storagenode/storagenodedb.(*DB).openDatabases:337\n\tstorj.io/storj/storagenode/storagenodedb.OpenExisting:302\n\tmain.cmdRun:67\n\tmain.newRunCmd.func1:33\n\tstorj.io/common/process.cleanup.func1.4:402\n\tstorj.io/common/process.cleanup.func1:420\n\tgithub.com/spf13/cobra.(*Command).execute:985\n\tgithub.com/spf13/cobra.(*Command).ExecuteC:1117\n\tgithub.com/spf13/cobra.(*Command).Execute:1041\n\tstorj.io/common/process.ExecWithCustomOptions:116\n\tmain.main:34\n\truntime.main:283\n\tmain.cmdRun:69\n\tmain.newRunCmd.func1:33\n\tstorj.io/common/process.cleanup.func1.4:402\n\tstorj.io/common/process.cleanup.func1:420\n\tgithub.com/spf13/cobra.(*Command).execute:985\n\tgithub.com/spf13/cobra.(*Command).ExecuteC:1117\n\tgithub.com/spf13/cobra.(*Command).Execute:1041\n\tstorj.io/common/process.ExecWithCustomOptions:116\n\tmain.main:34\n\truntime.main:283"}
2025-06-19T11:57:09Z    ERROR   services        unexpected shutdown of a runner {"Process": "storagenode", "name": "forgetsatellite:chore", "error": "database is locked"}
2025-06-19T11:57:09Z    ERROR   gracefulexit:chore      error retrieving satellites.    {"Process": "storagenode", "error": "satellitesdb: database is locked", "errorVerbose": "satellitesdb: database is locked\n\tstorj.io/storj/storagenode/storagenodedb.(*satellitesDB).ListGracefulExits:198\n\tstorj.io/storj/storagenode/gracefulexit.(*Service).ListPendingExits:59\n\tstorj.io/storj/storagenode/gracefulexit.(*Chore).AddMissing:55\n\tstorj.io/common/sync2.(*Cycle).Run:163\n\tstorj.io/storj/storagenode/gracefulexit.(*Chore).Run:48\n\tstorj.io/storj/private/lifecycle.(*Group).Run.func2.1:87\n\truntime/pprof.Do:51\n\tstorj.io/storj/private/lifecycle.(*Group).Run.func2:86\n\tgolang.org/x/sync/errgroup.(*Group).Go.func1:78"}
2025-06-19T11:57:09Z    ERROR   pieces:trash    emptying trash failed   {"Process": "storagenode", "error": "pieces error: lazyfilewalker: signal: killed", "errorVerbose": "pieces error: lazyfilewalker: signal: killed\n\tstorj.io/storj/storagenode/pieces/lazyfilewalker.(*process).run:85\n\tstorj.io/storj/storagenode/pieces/lazyfilewalker.(*Supervisor).WalkCleanupTrash:196\n\tstorj.io/storj/storagenode/pieces.(*Store).EmptyTrash:486\n\tstorj.io/storj/storagenode/pieces.(*TrashChore).Run.func1.1:86\n\tstorj.io/common/sync2.(*Workplace).Start.func1:89"}
2025-06-19T11:57:09Z    ERROR   piecestore:cache        error getting current used space for trash:     {"Process": "storagenode", "error": "filestore error: failed to walk trash namespace a28b4f04e10bae85d67f4c6cb82bf8d4c0f0f47a8ea72627524deb6ec0000000: context canceled", "errorVerbose": "filestore error: failed to walk trash namespace a28b4f04e10bae85d67f4c6cb82bf8d4c0f0f47a8ea72627524deb6ec0000000: context canceled\n\tstorj.io/storj/storagenode/blobstore/filestore.(*blobStore).SpaceUsedForTrash:302\n\tstorj.io/storj/storagenode/pieces.(*CacheService).Run.func1:104\n\tgolang.org/x/sync/errgroup.(*Group).Go.func1:78"}
2025-06-19T11:57:13Z    ERROR   failure during run      {"Process": "storagenode", "error": "database is locked"}
2025-06-19T12:17:49Z    ERROR   piecestore:cache        error getting current used space for trash:     {"Process": "storagenode", "error": "filestore error: failed to walk trash namespace af2c42003efc826ab4361f73f9d890942146fe0ebe806786f8e7190800000000: context canceled", "errorVerbose": "filestore error: failed to walk trash namespace af2c42003efc826ab4361f73f9d890942146fe0ebe806786f8e7190800000000: context canceled\n\tstorj.io/storj/storagenode/blobstore/filestore.(*blobStore).SpaceUsedForTrash:302\n\tstorj.io/storj/storagenode/pieces.(*CacheService).Run.func1:104\n\tgolang.org/x/sync/errgroup.(*Group).Go.func1:78"}
2025-06-19T12:17:49Z    ERROR   pieces:trash    emptying trash failed   {"Process": "storagenode", "error": "pieces error: lazyfilewalker: signal: killed", "errorVerbose": "pieces error: lazyfilewalker: signal: killed\n\tstorj.io/storj/storagenode/pieces/lazyfilewalker.(*process).run:85\n\tstorj.io/storj/storagenode/pieces/lazyfilewalker.(*Supervisor).WalkCleanupTrash:196\n\tstorj.io/storj/storagenode/pieces.(*Store).EmptyTrash:486\n\tstorj.io/storj/storagenode/pieces.(*TrashChore).Run.func1.1:86\n\tstorj.io/common/sync2.(*Workplace).Start.func1:89"}
2025-06-19T13:21:41Z    ERROR   gracefulexit:chore      error retrieving satellites.    {"Process": "storagenode", "error": "satellitesdb: database is locked", "errorVerbose": "satellitesdb: database is locked\n\tstorj.io/storj/storagenode/storagenodedb.(*satellitesDB).ListGracefulExits:198\n\tstorj.io/storj/storagenode/gracefulexit.(*Service).ListPendingExits:59\n\tstorj.io/storj/storagenode/gracefulexit.(*Chore).AddMissing:55\n\tstorj.io/common/sync2.(*Cycle).Run:163\n\tstorj.io/storj/storagenode/gracefulexit.(*Chore).Run:48\n\tstorj.io/storj/private/lifecycle.(*Group).Run.func2.1:87\n\truntime/pprof.Do:51\n\tstorj.io/storj/private/lifecycle.(*Group).Run.func2:86\n\tgolang.org/x/sync/errgroup.(*Group).Go.func1:78"}
2025-06-19T13:21:41Z    ERROR   services        unexpected shutdown of a runner {"Process": "storagenode", "name": "forgetsatellite:chore", "error": "database is locked"}
2025-06-19T13:21:41Z    ERROR   piecestore:cache        error getting current used space for trash:     {"Process": "storagenode", "error": "filestore error: failed to walk trash namespace af2c42003efc826ab4361f73f9d890942146fe0ebe806786f8e7190800000000: context canceled", "errorVerbose": "filestore error: failed to walk trash namespace af2c42003efc826ab4361f73f9d890942146fe0ebe806786f8e7190800000000: context canceled\n\tstorj.io/storj/storagenode/blobstore/filestore.(*blobStore).SpaceUsedForTrash:302\n\tstorj.io/storj/storagenode/pieces.(*CacheService).Run.func1:104\n\tgolang.org/x/sync/errgroup.(*Group).Go.func1:78"}
2025-06-19T13:21:43Z    ERROR   piecestore:cache        error persisting cache totals to the database:  {"Process": "storagenode", "error": "piece space used: context canceled", "errorVerbose": "piece space used: context canceled\n\tstorj.io/storj/storagenode/storagenodedb.(*pieceSpaceUsedDB).UpdatePieceTotalsForSatellite:188\n\tstorj.io/storj/storagenode/storagenodedb.(*pieceSpaceUsedDB).UpdatePieceTotalsForAllSatellites:159\n\tstorj.io/storj/storagenode/pieces.(*CacheService).PersistCacheTotals:144\n\tstorj.io/storj/storagenode/pieces.(*CacheService).Run.func2.1:127\n\tstorj.io/common/sync2.(*Cycle).Run:163\n\tstorj.io/storj/storagenode/pieces.(*CacheService).Run.func2:122\n\tgolang.org/x/sync/errgroup.(*Group).Go.func1:78"}
Volume 2 is high when it is running Hyperbackup and the Plex schedules tasks on a daily basis. But this had not caused any issue so far.
Appreciate any help !
Cheers.
Any clue what could be happenin, or how I can diagnose this further?