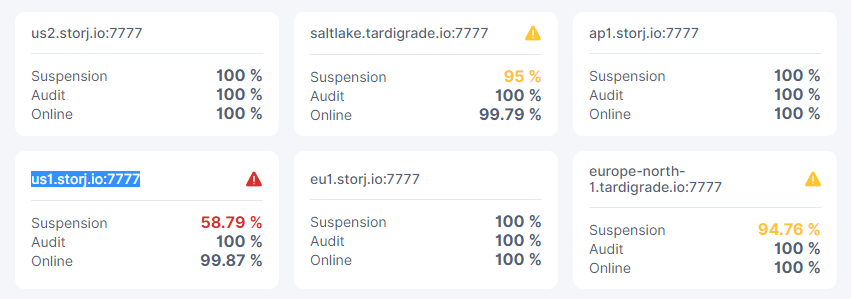
A title says, a node was suddenly suspended on us1.storj.io:7777. The reason given was ‘it produced errors too often during audits’.
The node dashboard shows all audits at 100%, lowest uptime is 99.79%. Nothing has changed on the hardware or software for this device in over a year, aside from routine security updates. How would I go about fixing this when not much information on these errors is given?
I have examined the logs and they look normal.
This node is running in a docker container on a NAS device fwiw
drops in suspension score usually happens due to failed audits, the reason this doesn’t show in the audit score is because the audits will be repeated later and thus failing once will not lower the audit score, if it’s successful when attempted later.
this can happen due to disk latency or such things which makes the node unresponsive or to slow to respond in time.
yeah looks like maybe your node is having trouble keeping up, are you seeing high iowait / disk backlog
and what disk model / storage setup are you using, SMR HDD’s can often have trouble keeping up with the rather extensive write IOPS of the storagenodes, which can lead to stuff like this.
Forgive me for saying so but I have trouble believing it’s data throughput issue. The unit is a QNAP TS-1635AX, the data is being written to a raid array of 6 8TB seagate ironwolf drives. I can pull the specific model number if needed but as far as I know there are no ironwolf SMR models. Disk usage is very low, this node has hardly any data yet, about 200GB.
I should note, I have another node running which has been operating continuously for more than a year. It is using an ancient USB WD external enclosure as its storage and shows zero audit errors. Same connection, same network, older hardware and lower throughput.
throughput and io isn’t exactly the same thing, disks in a raid works as one hdd and so your raid iops would be about the same as a single disk, atleast for dealing with the tons of small io a storagenode creates.
but if your disk backlog and iowait looks fine, then i guess thats not it… but usually when failing downloads its latency related… tho an hour seems rather extreme.
this basically says it waited for an hour, before timing out…
and then because you didn’t fail this same audit the second time it was attempted it must have been a success else your audit score should have dropped…
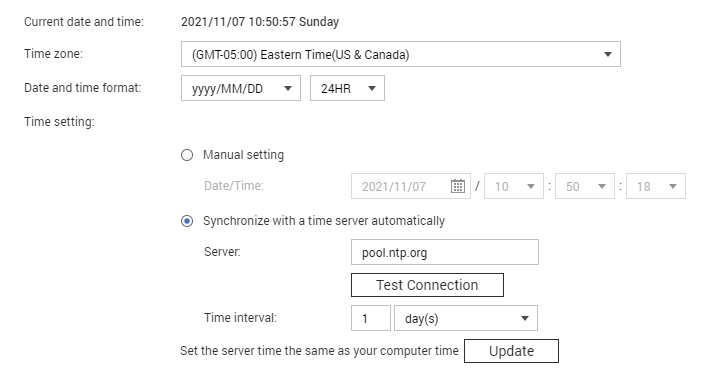
not like your system clock is wrong or something weird like that… i’m not sure the node would even work with wrong clock tho…
but it isn’t to long since we switched to winter time… so maybe… i think there was a couple of people having some issues with the switch to winter time… don’t recall the details tho…
so maybe check that your system clock of the nas is correct
when suspension score drops its almost always latency related.
your main problem currently is when you go back above 60% in suspension score for that satellite you will enter a 30 day trial period, and if your node drops below 60% again that satellite will DQ.
created 4 months ago… what version are you running?
you should be on v1.41.2
and if you aren’t your should update the node immediately and also install watchtower to take care of the automatic updates
I’m not terribly worried about getting disqualified on the node, it’s not utilized much. My objective is to understand what happened. I won’t miss the penny/month I earn from it. (not kidding)
I believe it is up to date but I will check it and get watchtower running.
I’ll mark your conjecture about the time change being the cause as the answer for now, I’m not sure what else would have caused it honestly. I certainly don’t have an hour+ of latency.
Thank you for your help!
Update: So all I did was restart the container, same version and image, same data. Now the node is unsuspended and shows lots of ingress. Maybe a problem with the container itself? who knows.
sometimes stuff is just weird, keep and eye on that the suspension score goes up and keeps going up, i forget how long that can take, but its days if not closer to 30 days total… to reach 100%
After several more hours of operation, it’s at 97.28% and out of danger. Just including this for anyone interested, apparently nodes recover extremely quickly from time drift.
A day later we’re at 99.91%. Remarkably fast recovery. I’ll stop updating at this point, it looks like this is solved. I was just reporting the numbers in case someone was curious about the recovery time. If anything further develops I’ll revisit this. Thanks all for the assistance!