Yeah, that’s been the temporary fix the last two times. The problem is docker stop storagenode does nothing, it just doesn’t respond. Sometimes need to hard boot the box which has it’s dangers also.
Certainly if you are using SMR drives, that may be an issue since they can perform slow writes which causes your cache to fill up and would explain your high memory condition.
Of course, there are many different configurations of nodes, so it’s difficult to guess what might be causing your issue. Have you made any changes to it lately?
These are non SMR drives in a Synology NAS. No issues for years until recently. Docker is current and no updates, No DSM updates within the last 3 months, not sure when the last Storj update was.
Seriously looking at downgrading to an earlier version of storj if that’s even possible.
I don’t recognize this issue. Not seeing it on my nodes. But then not all Synology NAS’s are the same.
@mi5key are you on DSM7 yet? If so, you can now see IO wait in the resource monitor on the CPU tab. I’m guessing it’s high. (this is usually the cause of high memory usage)
Either way, I’d need to know some more info to see what bottlenecks may be.
Which model NAS do you have?
How much memory does it have now (have you upgraded it)?
How many HDD’s and what kind of array?
Are you certain none of them are SMR? (unfortunately HDD manufacturers used to hide this for a long time and it’s still frequently only shown on spec sheets)
Do you use SSD cache, if so is it read/write?
How many nodes do you run on the system?
It would speed up the drop in score, but I doubt it has an impact on performance, seeing the increased RAM usage suggests this is probably an unrelated issue. I’m not seeing this on any of my nodes. So I’m pretty certain the answer is no.
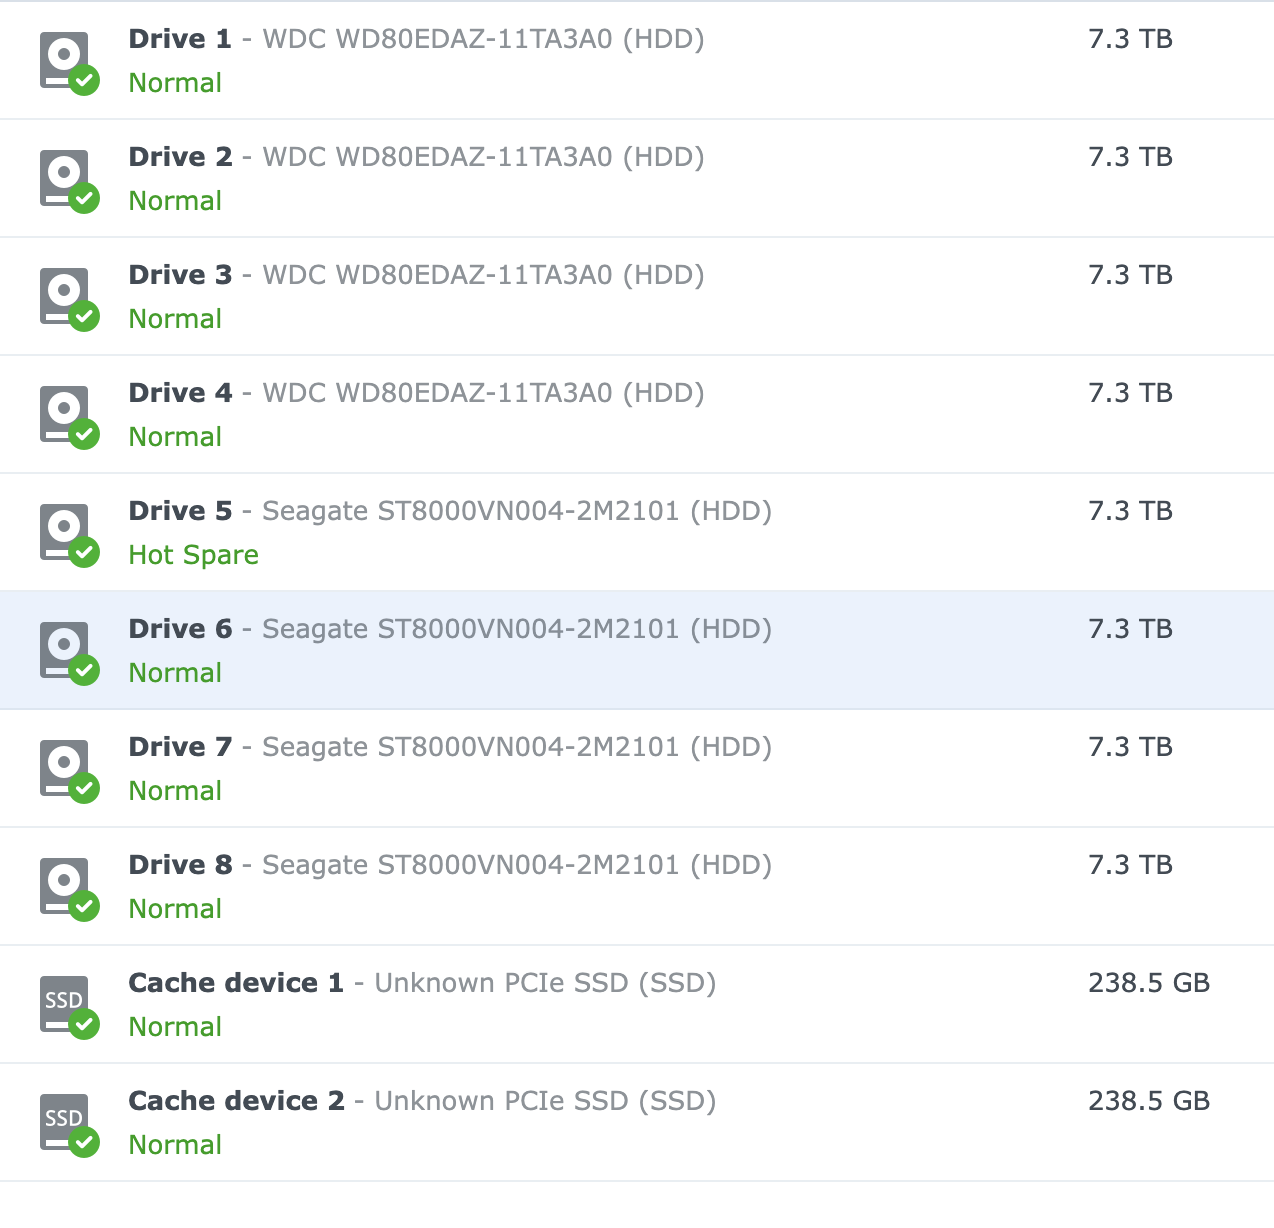
This is a DS1821+, eight 8TB drives, WD and Seagate Ironwolf, no SMR, I’m 99% sure, did a lot of research before picking these drives, 32GB of RAM (not Synology approved, but it’s been installed for 3 years now).
I’m on DSM7 (DSM 7.1.1-42962 Update 3, up to date) and IO wait is averaging 1-2% currently, load average is 0.86.
Docker stats shows process ram at 2.9GB, it was ~5GB earlier so it has gone down after the restart. Not sure what it normally was as I’ve never watched it this long to know the ‘normal’ baseline.
This is too high for the storagenode, I suspect that your storage is pretty slow. This could be indication of problems with at least a one disk.
I would recommend to check disks via S.M.A.R.T.
Just for reference
CONTAINER ID   NAME           CPU %     MEM USAGE / LIMIT     MEM %     NET I/O          BLOCK I/O   PIDS
1118c546300b   storagenode2   4.30%     195.6MiB / 24.81GiB   0.77%     81.9GB / 114GB   0B / 0B     76
01b285fe9949   storagenode5   0.16%     69.98MiB / 24.81GiB   0.28%     733MB / 2.01GB   0B / 0B     36
But these nodes works on separate disks, no array, this is a Windows docker desktop, so it also a Linux VM.
storj is the only part of the node that is hanging. Everything else is operating normally. The other 4 containers work great. They respond immediately to logs request.
I can exec a bash shell into the storagenode container just fine, it responds immediately.
because storagenode uses your storage unlike anything other. The container itself is not the reason. If your storage is slow, then storagenode will use more RAM to buffer uploads to your node, because the disk is not able to keep up.
and again I’m talking not about how much free space on your disk, the disk is slow to respond/store data. Perhaps reads too, because it leads to low suspension score, so you definitely have issues with audits, you may search for exact errors:
So please, check your disks first. I meant with fsck (or with UI analogue on your Synology - here I’m not sure how to do it on Synology), then S.M.A.R.T. with tools available for Synology.
I whould stopnode and rm all of them, just to clear the logs. Then I’ll start them with Filewalker off (see the topic Tuning the Filewalker), to see if the FW is the culprit. You will see high I/O from the garbage colector, but for a short period. Also, I whould set loglevel=error to keep logs at a manageble size.
Other things to consider on Synology:
memory compression OFF
DDOS protection OFF
Specter and Meltdown protection OFF (this one I’m not sure if matters for the performance of the node; I didn’t saw any difference on a 4 TB node).
Activate the Performance history to see how resources are used after restart.
Restart the Diskstation, manual update the nodes, than start the nodes.
Also, I see you use SSDs for cache, maybe they are the problem? BrightSilence had a nasty surprise with them.
Also… Docker is reporting wrong memory usage; I think it shows also the cache used, not just the used memory.
You should see the true usage in Performance tab, after running the nodes for 12 hours.